|
|||||||
|
|
|||||||
       |
Practical Field Information about Telecommunication Technologies Vol. 9, No. 12, pp. 66–71, Dec. 2011. https://doi.org/10.53829/ntr201112pf1 Visualization of Problems with Wireless Local Area NetworksAbstractThis article introduces a tool for visualizing problems related to wireless local area network (WLAN). NTT EAST has developed the wireless trouble shooting tools in order to solve Electromagnetic compatibility (EMC) problems in the field. It is the eighth in a bimonthly series on the theme of practical field information about telecommunication technologies. This month's contribution is from the EMC Engineering Group, Technical Assistance and Support Center, Maintenance and Service Operations Department, Network Business Headquarters. 
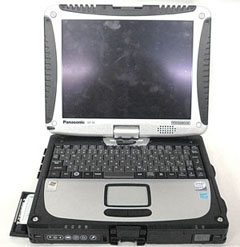
1. IntroductionA wireless local area network (WLAN) provides a variety of convenient features, not the least of which is easy deployment without the need for wiring or cabling in customer premises or office buildings and so on. WLANs are also making progress in terms of higher transmission speeds, improved interconnectivity, and lower fees. WLAN usage has gone beyond personal computers to include game consoles, personal digital assistants (PDAs), mobile phones, music players, and other devices. However, it tends to be difficult to isolate the causes of problems like failed connections, dropped connections, and drops in throughput because WLAN signals are invisible to the human eye. Moreover, spectrum analyzers for measuring signals and early WLAN analysis tools require advanced, specialized skills to operate, and these tools are so expensive that they are not widely used in the field. Therefore, the Technical Assistance and Support Center has developed a WLAN troubleshooting tool (Fig. 1) designed from the perspective of maintenance personnel working in the field. By adding a WLAN monitoring function to its previous WLAN troubleshooting tool [1], [2], NTT EAST expects to make WLAN troubleshooting faster and even more efficient. The new tool visualizes WLAN problems, making them easier to understand and solve. It is now being introduced into the maintenance department.
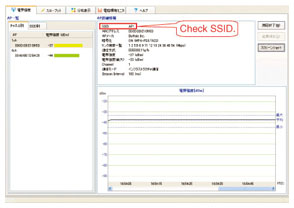
This article presents examples of the use of this tool to troubleshoot and solve WLAN problems that commonly occur in the field. 2. Main functions of WLAN troubleshooting toolThe WLAN troubleshooting tool conforms to the IEEE802.11a/b/g WLAN standards and incorporates the following five functions. (1) Access point detection function (2) Signal strength measurement function (3) Throughput measurement function (4) Signal strength distribution display function (5) Electromagnetic environment monitoring function These five functions enable even personnel without specialized skills in WLAN and radio signals to measure and analyze WLAN conditions and the peripheral environment. In more detail, the access point (AP) detection function can be used to display nearby APs by channel and service set identifier (SSID) and to check channel usage conditions so that a channel that is not easily affected by other APs can be selected. The signal strength and throughput measurement functions enable receive signal strength and throughput to be measured at any point in real time. This enables the troubleshooting of problems such as low throughput due to a drop in signal strength. The signal strength distribution display function displays measured signal strength and throughput on a two-dimensional floor map so that areas with insufficient signal strength or those with poor throughput due, for example, to interference can be identified. Finally, the electromagnetic environment monitoring function can be used to detect interference from industrial, scientific, and medical (ISM) devices using the same 2.4-GHz frequency band as specified by the IEEE802.11b/g standards. 3. Examples of WLAN troubleshootingSome examples of using the WLAN troubleshooting tool to identify and solve actual WLAN problems are given below. 3.1 Erroneous SSID for WLAN APThe SSID is an AP setting and an identifier that separates groups of WLAN connections. The AP and WLAN terminal must agree on this symbol in order to establish a connection. Since the SSID is case sensitive, the AP detection function can be used as shown in Fig. 2 to quickly discover a SSID setting mistake by checking the actual SSID assigned to the AP in question.
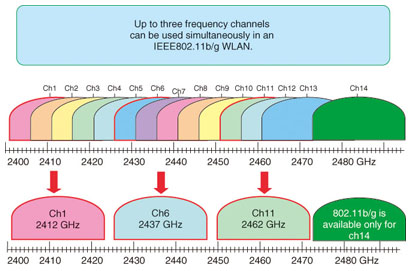
3.2 WLAN channel interferenceThe channels specified by the IEEE802.11b/g standards have an overlapping configuration, as shown in Fig. 3. To avoid interference between WLAN signals, they need to be separated by five or more channels as in a ch1/ch6/ch11 arrangement (ch: channel). The AP detection function can be used to display all measured APs by channel to enable maintenance personnel to examine the overall state of channel use.
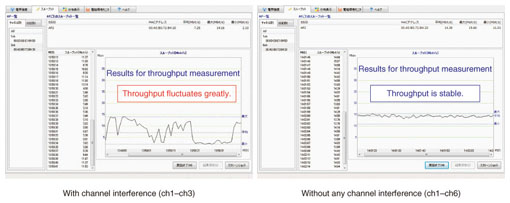
The effects of channel interference on throughput are shown in Fig. 4. If two APs—one set to ch1 and the other to ch3—begin to transmit at the same time, the effects of channel interference will cause throughput to fluctuate greatly in the range of 2–15 Mbit/s. However, if these two APs are set to ch1 and ch6, they will be separated by at least five channels, which prevents mutual interference. As a result, throughput becomes stable at about 15 Mbit/s even if ch1 and ch6 are transmitting simultaneously.
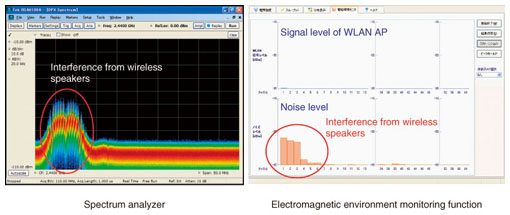
3.3 Interference from ISM devicesWLANs specified by the IEEE802.11b/g standards make use of the ISM 2.4-GHz band, which is also used by microwave ovens, wireless appliances, and medical equipment. Interfering signals from ISM devices can degrade throughput and impair communications. First, we examine the effects of wireless speakers using the 2.4-GHz band. A wireless-speaker system consists of transmission equipment connected to a television set or piece of audio equipment and the wireless speakers themselves. The transmission equipment transmits audio signals by using the 2.4-GHz band so that the audio can be reproduced at the wireless speakers. A key characteristic of a wireless-speaker system is that it continues to transmit signals on its transmission channel even if there is a WLAN in the vicinity. By contrast, the WLAN begins to transmit signals after performing carrier sensing and checking channel-usage conditions. As a consequence, a wireless-speaker system using a certain transmission channel can prevent a WLAN from beginning to transmit, cause throughput to drop noticeably, or prevent a connection from being established between the AP and terminal. An example of measuring interference from wireless speakers by using a spectrum analyzer and the electromagnetic environment monitoring function is shown in Fig. 5. The spectrum analyzer displays signal level (vertical axis) versus frequency (horizontal axis). These measurement results show that the interference from the wireless speakers had a frequency component in the 2400–2430 MHz range, which corresponds to the ch1–ch5 range for WLANs. The electromagnetic environment monitoring function likewise showed a high noise level in the ch1–ch5 range.
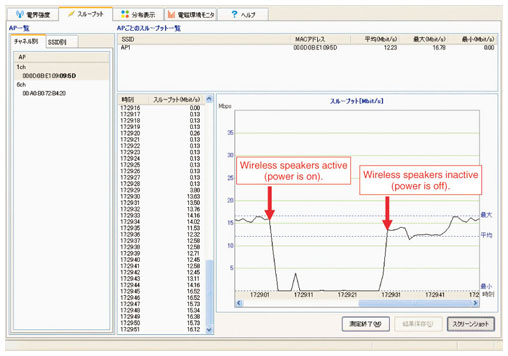
Throughput affected by interference from wireless speakers is shown in Fig. 6. The throughput dropped from about 15 Mbit/s to 0 Mbit/s as soon as the power to the wireless speakers was turned on and returned to about 15 Mbit/s when the power was turned off.
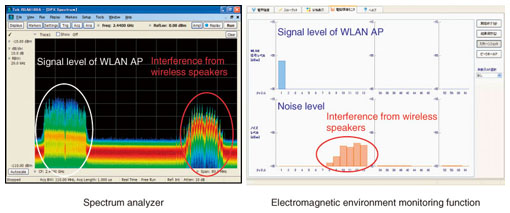
As shown in Fig. 7, one measure for preventing wireless speaker signals from interfering with a WLAN is to change the channel used by either the AP or the wireless-speaker system.
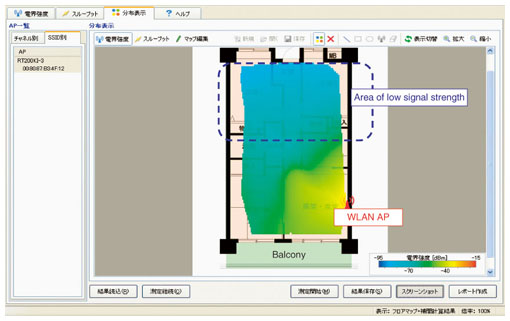
3.4 Drop in receive signal strengthThe field strength (measured electromagnetic power) distribution display function can be used to identify areas of low signal strength for a certain AP so that relocation of the AP or the addition of another AP can be considered. An example of measured signal strength in an actual residence is shown in Fig. 8. This measurement reveals that AP signals did not sufficiently reach the blue area relatively far from the AP. A countermeasure such as relocation of the AP or the addition of another AP can therefore be considered.
4. ConclusionThis month's report presented examples of troubleshooting for actual WLAN problems using a tool developed by the Technical Assistance and Support Center. It would give us great pleasure if this tool finds widespread use in the field. References
|
||||||