|
|||||||||||||||||
|
|
|||||||||||||||||
       |
Regular Articles Vol. 10, No. 9, pp. 41–50, Sept. 2012. https://doi.org/10.53829/ntr201209ra1 Method of Handling Hard Disk Drive Failures in Cloud Computing EnvironmentAbstractIn this article, we present a method of handling failures of hard disk drives (HDDs) in a cloud computing environment deployed for research and development purposes. We identified two problems associated with HDD failures: (1) how to ascertain the failure frequency of each HDD and (2) how to ascertain the lifetime of a specific HDD. For the first problem, we devised a method for estimating the necessary number of replacement HDDs by using an HDD lifetime distribution. For the second problem, we devised a method for estimating the remaining life of an HDD by using HDD failure physics and replacing all HDDs on a preventative basis during regular maintenance.
1. IntroductionNTT Software Innovation Center is researching and developing an R&D (research and development) cloud in order to establish technologies for developing cloud computing services. Because this R&D cloud consists of a large number of diverse devices, one important issue for its operation is how to handle frequent device failures. This issue can be divided into two main problems. The first problem is how to ascertain the failure frequency of each type of device. Failed devices are usually replaced during maintenance. To ensure that enough replacement devices are kept on hand, it is necessary to forecast the number of device failures in a given time period by considering the failure frequency of each type of device. To solve this problem, a failure rate model that uses a statistical lifetime distribution*1 independent of the target device is effective. The second problem is how to ascertain the lifetime of a specific device. Devices expected to fail are usually identified and replaced as a preventative measure during regular maintenance. Determining the likelihood of failure requires forecasting the lifetime of each device. While it is possible to apply the failure rate model with a statistical lifetime distribution as described above for this problem, its forecasting accuracy is low, a few percent at best, so it cannot be used without modification. To solve this problem, a failure rate model with improved forecasting accuracy achieved through active use of knowledge (failure physics*2) about the particular device is effective. In this article, we report examining hard disk drives (HDDs), which fail relatively frequently, and developing an HDD failure rate model for a cloud computing environment used to implement an R&D cloud. We analyzed the past failure statistics of an HDD cluster that had a particularly high rate of HDD failures in the R&D cloud and devised two methods of estimating HDD failure rates (Sections 2 and 3, respectively). Section 2 describes the application of a failure rate model using statistical lifetime distributions for HDD failures. As a specific application of this model, we present a method for estimating the number of HDDs required over a specific time period in order to have a sufficient number of replacement HDDs on hand. Section 3 describes the application of a failure rate model using failure physics for HDD failures. As a specific application of this model, we present a method for discovering HDDs likely to fail and replacing them preventatively during regular maintenance. Finally, Section 4 concludes with a summary.
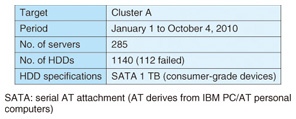
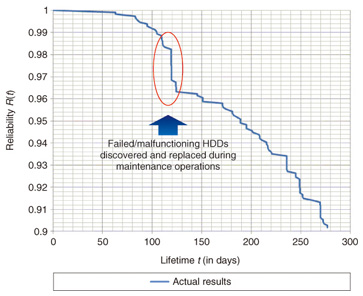
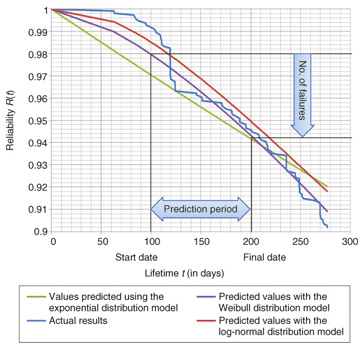
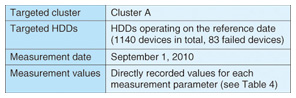
2. Method for ascertaining HDD failure frequenciesReplacement HDDs were stockpiled prior to the startup of the R&D cloud’s high-failure-rate cluster (Cluster A). The number intended to be sufficient for a year was calculated assuming, on the basis of existing research [1], [2], the annual failure rate*3 to be 3%. After Cluster A went into operation, however, HDD failures began occurring at an annual failure rate of over 10% and the stock of replacement HDDs was exhausted in three months. From this experience, we established a method of estimating the necessary number of replacement HDDs by applying a failure model based on a statistical lifetime distribution for HDD failures. Before constructing a failure rate model based on a lifetime distribution, it is necessary to investigate which distribution model the lifetime distribution adheres to. In the following sections, we find the lifetime distribution from past failure statistics of HDDs in Cluster A and attempt to fit three lifetime distribution models. Finally, we evaluate the three lifetime distributions to determine which has the best fit to the lifetime distribution. 2.1 Determining past failure statisticsA log was kept noting the time and date of each HDD replacement. The failure statistics are summarized in Table 1. The HDD lifetime distribution in Fig. 1 was derived from the failure statistics given in Table 1. The horizontal axis in Fig. 1 represents the number of days elapsed from the reference date and the vertical axis represents the reliability of the HDDs in use on the reference date. The sudden drop in reliability at around the 120-day mark is explained by the discovery and replacement of failed or malfunctioning HDDs during maintenance conducted between April 30 and May 6, 2010.
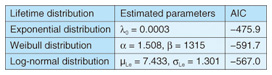
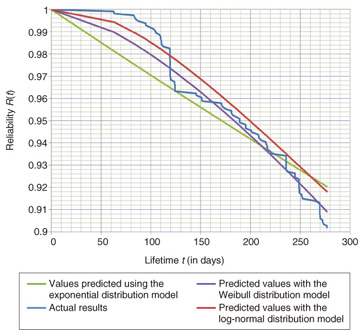
2.2 Fitting past failure statistics to lifetime distribution modelsNext, we selected three lifetime distribution models—exponential distribution, Weibull distribution, and log-normal distribution—as candidates for fitting the past failure statistics shown in Fig. 1. The exponential distribution expresses the reliability R(t) with Equation 1, where the failure rate λ(t) is constant. The Weibull distribution expresses the reliability R(t) with Equation 2, where the failure rate varies according to shape parameter α and scale parameter β. The log-normal distribution expresses the reliability R(t) and failure rate λ(t) with Equation 3, where the log of lifetime t follows a normal distribution.  We estimated parameters to fit the failure statistics in Fig. 1 to these three distribution models. The results are listed in Table 2, and the values predicted using the lifetime distribution models are given in Fig. 2.
2.3 Evaluating the goodness of fitIt is not possible to tell from Fig. 2 which of the three models is the best fit. Therefore, we used the Akaike information criterion (AIC)*4, a measure developed by Hirotsugu Akaike, to evaluate each model’s goodness of fit. The AIC value for each model was found using Equation 4.  In this equation, n is the number of samples, Se is the residual sum of squares, and p is the number of predictor variables. For the exponential distribution model, p = 1 was used, whereas for the Weibull distribution and log-normal distribution models, p = 2 was used. The AIC results for the lifetime distribution models are also listed in Table 2. We can see that the Weibull distribution is the best fit for the past failure statistics and the log-normal distribution is the next best fit. This result is also consistent with existing research [2]. Therefore, it is reasonable to fit the Weibull distribution to the HDD lifetime distribution. 2.4 Method for estimating the necessary number of replacement HDDsAs a final step, we devised a method for estimating the necessary number of replacement HDDs. To do this, we first estimated the parameters of the failure rate model (Weibull distribution) for each HDD product using failure statistics over the most recent six-month to one-year period. For example, it is possible, using the failure rate model (Weibull distribution) shown in Fig. 3, to estimate the number of failures over a certain period by multiplying the total number of HDDs by the difference in reliabilities between the start date (day 100) and the final date (day 200). The necessary number of replacement HDDs can be easily worked out from the number of failures.
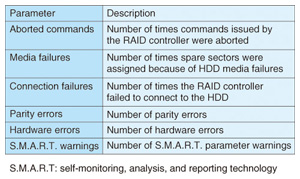
3. Method for ascertaining HDD lifetimesThe R&D cloud requires maintenance each time an HDD fails in order to replace or repair the HDD. User convenience can be improved if HDDs with little remaining life can be discovered and replaced preventatively during regular maintenance. Since the forecasting accuracy of failure rate models based on lifetime distributions is too low, as mentioned in Section 1, we applied a failure rate model that uses failure physics to improve the forecasting accuracy for HDD failures. 3.1 Fitting results to a rate process modelThe rate process model is widely used in accelerated tests for electronic components including HDDs. It expresses the lifetime t with Equation 5. Therefore, we continue the argument in this article on the assumption that HDD failure physics conforms to the rate process model. In this equation, S is the load (physical stresses and voltage), U is the activation energy, k is Boltzmann’s constant, T is the absolute temperature, and B and n are constants. The absolute temperature can be considered to be constant since the R&D cloud’s computing environment is climate controlled to ensure uniform temperature and humidity levels. Assuming constant temperature means that B • exp(U/kT ) is also constant because U, k, and B are constants. Replacing this constant in Equation 5 with C gives Equation 6. Taking the log on both sides of Equation 6 gives Equation 7. Equation 7 can be applied as a failure rate model (lifetime model) based on HDD failure physics under fixed temperature conditions. However, it is necessary to estimate parameters C and n for each HDD product in order to forecast the lifetime t by using Equation 7’s failure rate model. Estimating C and n requires measuring the load S (physical stresses and voltage) applied to the HDD and the resulting lifetime t. Because of the difficulty in making these measurements, we made the following two assumptions for the purposes of this article. 3.1.1 Assumptions about load SThe load S (physical stresses and voltage) applied to an HDD consists of vibrations and impacts (physical stresses) and excess voltages. For example, applying vibrations or impacts to an HDD will cause media scratches and media failures. If spare sectors are assignable, the RAID (redundant array of independent disks) card will record the number of media failures, but if spare sectors are not available, the HDD will fail. Thus, applying load may cause a failure. If recovery from the failure is possible, this is recorded in the HDD information, but if not, the HDD will fail. Since the load can be approximated from HDD information that is measureable via the RAID controller, we assumed a linear relationship exists between the load and some HDD information. 3.1.2 Assumptions about lifetime tWhile it is possible to measure the lifetime t of an HDD to which a load S has been applied once all HDDs in a cluster have failed, lifetime estimation is meaningless at this point. Instead, we collected HDDs where the applied load fell in a certain region using statistical techniques and assumed that the average lifetime µ found from the reliability R(t) of HDDs in the collection is equivalent to the lifetime t [3]. The average lifetime µ is expressed with Equation 8 in the failure rate model (Weibull distribution) described in Section 2. Furthermore, α can be assumed to be constant within the range of ordinary usage, although α does change when larger loads are applied. 3.2 Examining the correlation between HDD information and average lifetimesWith the above two assumptions, it is possible to estimate parameters C and n from the correlation between HDD information and average lifetimes. In this section, we provide an example of estimating them for Cluster A, as used before in Section 2. 3.2.1 Measuring HDD informationThe measurement conditions and parameters used to measure HDD information are given in Tables 3 and 4, respectively. After measuring the HDD information, we found the frequency distribution of HDDs where HDD information values fell in certain segments (i.e., the number of HDDs) and the frequency distribution of failed HDDs in each segment (i.e., the number of failures). The segments selected were 0 to 1 and 2n–1 to 2n – 1 (where n is an integer larger than 1). The segments were selected using the knowledge that the equations are logarithmic.
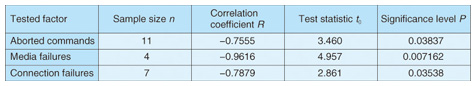
From the number of HDDs and the number of failures, we found the reliability R(t) in each segment and found β with Equation 2 and the average lifetime µ with Equation 8. Because α was assumed to be constant, the value found in Section 2 (α = 1.508) was applied. 3.2.2 Identifying HDD information needed for correlation with average lifetimeUsing the method described above, we found a correlation between HDD information and the average lifetime. Of the HDD information measurement parameters in Table 4, some degree of correlation was found for the number of aborted commands, the number of media failures, and the number of connection failures. Parameters C and n were estimated using this correlation. The correlation between aborted commands A.C. and average lifetime µ is shown in Fig. 4. We performed a linear regression analysis with the expectation of a negative linear relationship between the logarithm of aborted commands and the logarithm of average lifetime. Equation 9 was obtained as an approximation curve. Note that the Pearson product-moment correlation coefficient is R = -0.7555.
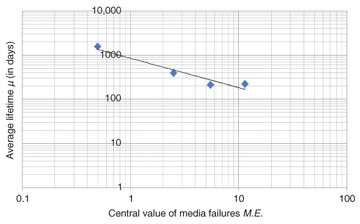
The correlation between media failures M.E. and average lifetime µ is shown in Fig. 5. We performed a linear regression analysis again, and Equation 10 was obtained as an approximation curve. Note that the Pearson product-moment correlation coefficient in this case is R = -0.9616.
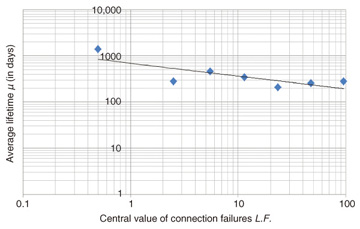
The correlation between connection failures L.F. and average lifetime is shown in Fig. 6. We performed a linear regression analysis again, and Equation 11 was obtained as an approximation curve.
3.2.3 Validating the correlationsFrom Figs. 4, 5, and 6, it is not possible to determine whether the correlations are statistically significant. Therefore, we examined the correlations with a significance test using Pearson product-moment correlation coefficients. The test statistic t0 in the significance test is expressed by Equation 12.  Here, n is the sample size (number of data points) and R is the sample correlation coefficient. Because t0 follows the t distribution with n – 2 degrees of freedom, the significance level P was found to be P=Pr{| t | ≥ t0}. The results are listed in Table 5. With the acceptable level of significance set to 5% (P ≤ 0.05), the numbers of aborted commands, media failures, and connection failures were recognized as having statistically significant correlations with the average lifetime.
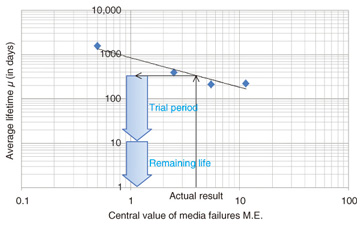
3.3 Method for estimating HDD lifetimesFinally, we describe a method for estimating HDD lifetimes. First, we ascertained the past failure statistics of the targeted cluster and examined the correlation between HDD information and average lifetime. When given a specific HDD, the method measures the HDD’s information, fits the information to known correlations, and estimates the average lifetime. The remaining life can be calculated by subtracting the time in use to date. If an HDD has a short remaining life, it is replaced with a new one. For example, the lifetime of an HDD with four media failures (measured value) is estimated using Equation 10 to be 338 days, given the correlation between media failures and average lifetime shown in Fig. 7. If the HDD had been in use for 328 days at the time of the measurement, it would be replaced with a new HDD since its remaining life would be only 10 days.
The R&D cloud is managed and operated through a system that displays resources such as power consumption. We plan to integrate this method with the resource visualization system, as illustrated in Fig. 8, in the future to let cloud operators ascertain the remaining lives of HDDs at a glance.
4. ConclusionIn this article we described a method of handling HDD failures that occur frequently in the operation of an R&D cloud. In Section 1, we indicated two problems associated with HDD failures: how to ascertain the failure frequency of each HDD and how to ascertain the lifetime of a specific HDD. In Section 2, we described an approach to the first problem. We began by examining the past HDD failure statistics of a high-failure-rate cluster (Cluster A). We found the HDD lifetime distribution from the failure statistics and fitted them to three lifetime distribution models. Using the Akaike information criterion, we demonstrated that the Weibull distribution (with shape parameter α of 1.508) was the best fit for the HDD lifetime distribution. We then applied this finding in a method for estimating the necessary number of replacement HDDs. In Section 3, we described an approach to the second problem. We began by assuming that HDD failure physics follows the rate process model and examined the correlation between information about HDD output by RAID controllers and the average lifetime in Cluster A, which was also used in Section 2. We described how a statistically significant correlation was recognized between specific HDD information (numbers of aborted commands, media failures, and connection failures) and the average lifetime using a significance test with Pearson product-moment correlation coefficients. We then applied this finding in a method for estimating the remaining life of HDDs so that HDDs with short remaining lives can be replaced on a preventative basis during regular maintenance. We also described the concept of integrating this work with resource visualization systems. The results of this research will enable us to reduce the operations for preparing replacement HDDs and those for replacing HDDs when HDD failures occur. Consequently, the operation of large-scale cloud computing environments, such as an R&D cloud, will become even more efficient. References
|
||||||||||||||||