|
|||||||||||||||||||||||
|
|
|||||||||||||||||||||||
       |
Regular Articles Vol. 11, No. 3, pp. 32–41, Mar. 2013. https://doi.org/10.53829/ntr201303ra1 Virtual Sensor Construction Technique for Participatory Sensing EnvironmentsAbstractMuch attention is being focused on participatory sensing, in which real-world data are collected using personal mobile devices as sensor nodes to sense various conditions of the world we live in. In this approach, sensor nodes are not controlled by a sensing system; they move and sense independently. Therefore, the sensing data may include noise or missing values and are therefore difficult to use as-is for applications. We are investigating a technique to construct virtual sensors in order to provide reliable and flexible sensing data. In this article, we introduce a construction technique that consists of three core methods to enhance data quality: participation promotion using our Top of Worlds technique, noise reduction, and missing value estimation. We also describe a simple demonstration we conducted that shows how these factors enhance data quality.
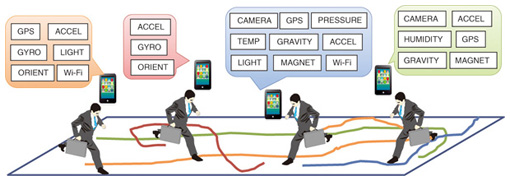
1. IntroductionWorldwide smartphone use is currently estimated to be 12% and is predicted to increase to 50% in five years [1]. These mobile devices are usually equipped with several sensors that capture visual, acoustic, tactile, location, and other data. This makes them suitable devices for participatory sensing, which has been attracting global attention [2]. Participatory sensing, also called human/people-centric sensing, is an approach for collecting and analyzing data in which individuals, acting alone or in groups, use their personal mobile devices and cloud services to sense and share various conditions of their surroundings. We call such data real-world data. The concept of participatory sensing is shown in Fig. 1. This approach is an alternative to conventional sensing environments where stationary sensor nodes that are dominated, i.e., controlled, by a sensor system are installed in a target area. The conventional approach is not suitable for wide-area sensing because it requires a large number of sensor nodes that are expensive to install and maintain. Such costs are not incurred with the participatory sensing approach, which can be used with existing devices. The data obtained in participatory sensing will be useful in applications that have a significant socio-economic impact. Such applications include, but are not limited to, environmental monitoring, pedestrian navigation, urban planning, pandemic prevention, disaster recovery, and energy management.
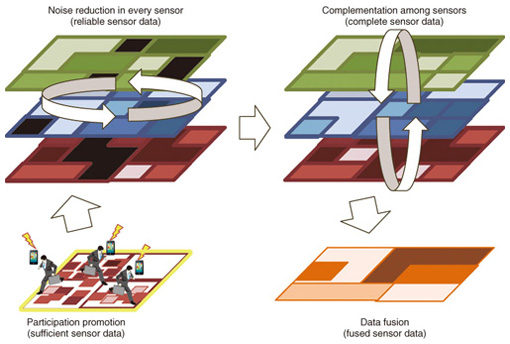
Recent advances achieved in sensor devices and wireless networking technologies mean that participatory sensing is becoming more and more possible; however, technical challenges remain. One of the key challenges is determining how to enhance defective data. In participatory sensing, sensor nodes are not under the control of a sensing system; they move and sense independently. The system cannot sense targets systematically as in conventional controlled sensing and cannot always obtain the intended data in the intended form when needed. That is to say, raw participatory sensing data are defective and difficult to use as-is for applications. Therefore, we believe that sensor virtualization, which provides reliable virtual sensor data produced from related (actual) data, is essential for participatory sensing. We introduce here three techniques to enhance data quality: participation promotion, noise reduction, and missing-value estimation. These techniques enhance the quality of participatory sensing data and make virtual sensors reliable and flexible. In section 2, we discuss various issues concerning participatory sensing data. Then we briefly review related work in section 3. In section 4, we explain the three data quality enhancement techniques used in virtual sensor construction. In section 5, we discuss a demonstration of virtual sensors constructed using our techniques based on a sample scenario. Finally, we conclude the article in section 6. 2. Issues concerning participatory sensingThis section addresses participatory sensing issues, specifically defective data. The largest difference between conventional and participatory sensing is that sensor nodes of the former are dominated; i.e., they are controlled by a system, whereas sensor nodes of the latter are not. In participatory sensing, sensing conditions such as time, location, and angle depend on each individual’s behavior, and sensor module specifications such as type and accuracy depend on the individual devices; we cannot typically control them. Moreover, whether or not to sense or to transmit data also depends on the will of individual participants. This means that most of the collected data is defective—sparse, noisy, and distorted. We discuss these three issues below. 2.1 Sparseness (insufficient quantity of data)The first issue is data sparseness, namely, the insufficient supply of data. Participatory sensing does not work without people’s participation. However, participants must use their own battery power and pay the data transmission charge, so it may be difficult to collect sufficient data solely by depending on volunteers; therefore, the collected sensing data may be sparse. One way to collect data is to provide a financial incentive to people. This improves their extrinsic motivation to participate; however, it may increase sensing system operating costs. Furthermore, a psychological study [3] found that extrinsic motivation is unsustainable. Therefore, a method to promote participation by improving intrinsic motivation is necessary. 2.2 Noise (inaccurate data)The second issue is noise, namely, inaccuracy. Participatory sensing involves sensor modules installed in personal mobile devices. In general, such sensor modules are less accurate than specially tuned stationary sensors used in conventional sensing. Additionally, the accuracy of such personal use sensor modules is probably not uniform because there are many types of products. Therefore, the sensing data may be noisy. We must reduce the noise and enhance the accuracy of the data in order to use such data in applications. 2.3 Distortion (incomplete data)The last issue is distortion of data, namely, incompleteness. In participatory sensing, the sensing time and location are basically left up to the participants. Participants can freely move, sense objects, and transmit the sensing data. Consequently, it is easy to collect sensor data in spaces where many people gather, whereas it is difficult to collect data where fewer people gather. In addition, the type of sensor to carry depends on the participant’s device. For example, one participant’s device may be equipped with sensor modules A and B, while another participant’s device may only have sensor module A. Therefore, it is easy to collect data from commonly used sensors but difficult to do so from sensors that are used less frequently. As a result, participatory sensing data are unevenly distributed in time and space and are therefore incomplete; in other words, they include many missing values. We must compensate for any missing values in applications. 3. Related workMany studies have been conducted on sensor virtualization for participatory sensing, and some have focused on enhancing the quality of sensing data. Weinschrott et al. [4] proposed virtual sensor abstraction algorithms, collectively called StreamShaper, for mobile urban sensing. They focused on enhancing the coverage of virtual sensors; however, they did not take the reliability of virtual sensor values into account. Ganti et al. [5] proposed a navigation service called Green GPS that suggests the most fuel-efficient routes to drivers. They focused on compensating for missing values. Green GPS builds a generalized hierarchical model for various vehicle types and merges the various sensor data by using the model; this increases the service coverage, but it requires an elaborately tuned model. The issue of participant motivation has also been investigated in several studies. Reddy et al. [6] investigated a method to motivate users to participate in sensing; however, they presuppose the incentive payment model. To motivate users to participate in a paragliding community service, Kaenel et al. [7] developed a method of presenting the rank of each user’s paragliding distance calculated from GPS data as information for users to compare with other users. However, because this method only ranks each user among all other users, most users have little chance of being ranked in the top group. Therefore, we believe that the motivational effect of this method would be small for most users. We believe that a comprehensive approach to enhancing the quality of sensing data is important to provide reliable virtual sensors for applications. 4. Virtual sensorWe are researching virtual sensor construction techniques that enhance the quality of participatory sensing data against the issues mentioned in section 2 and that produce virtual sensor data from enhanced sensor data sets for various applications. The flow of our construction technique is shown in Fig. 2. First, sufficient sensor data are collected by using a technique to promote user participation. Second, the reliability of sensor data sets is enhanced using a noise reduction technique. Finally, incomplete data are compensated for using a multiple regression technique. Additionally, a new sensor data set that fuses the data collected from all sensors is produced if necessary. In this section, we explain each of our data quality enhancement techniques.
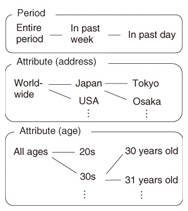
4.1 Participation promotionBecause participatory sensing requires input of sensor data from users, the users must feel motivated to continue participating. We focused on improving users’ intrinsic motivation by promoting a sense of superior achievement. We proposed Top of Worlds [8], a method for strengthening the motivation of users to participate in sensing by presenting rankings in multidimensional hierarchical sets. A previously proposed method [7] only ranks each user among all other users, so most users have little chance of being ranked in the top group and may have little motivation to continue. Top of Worlds creates many sets with varying granularity to increase the chance of many users being ranked in the top group and presents these rankings in those sets. An example of values used to compare rankings is the amount of sensor data transmitted by users. Top of Worlds is based on two hypotheses: - H1. If a user is ranked in the top group, her/his motivation will increase compared to when the user is not in the top group. - H2. If a user is ranked in the top group in multiple sets, the coarser the granularity of the set is, the more her/his motivation will increase. On the basis of H1, our proposed method is composed of the following steps: 1. many sets are created with varying granularity to increase the chance of many users being ranked in the top group; 2. sets are selected in which a user ranks in the top group. For example, step 1 involves creating multidimensional hierarchical sets by time period and by attribution (address, age, or sex). In step 2, sets are selected among multidimensional hierarchical sets in which a user ranks in the top group. We define hierarchical sets based on time period (entire period, in the past week (one-week period up to now), in the past day (one-day period)), address (worldwide, nationwide, statewide (citywide)), and age (all ages, a certain age range, e.g., 20s and 30s, or a specific age), as shown in Fig. 3. We define a multidimensional hierarchical set as a common subset of each hierarchical set.
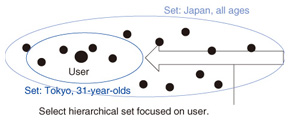
On the basis of H2, if a user ranks in the top group in multiple sets, Top of Worlds is composed of the following additional steps: 3. a set with the coarsest granularity (the longest period, largest address segment, or broadest age range) is selected; 4. information on the set and the rank is presented to the user (we skip step 3 if the user ranks in the top group in only one set). An example of Top of Worlds is shown in Fig. 4. We assume the user lives in Tokyo and is 31 years old. If the user is given information such as You are 50,000th in Japan among all ages out of 100,000 people, the user may not be motivated to continue. Therefore, Top of Worlds selects a hierarchical set focused on the user and presents information such as You are ranked 1st in Tokyo among fifty 31-year-olds to the user. As a result, the user will be motivated to continue participating. Thus, Top of Worlds effectively increases the motivation of many users.
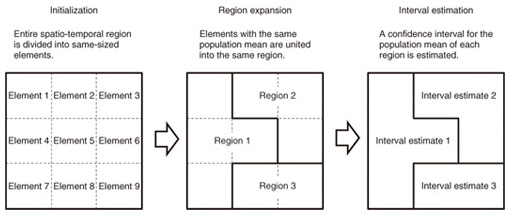
4.2 True value estimation4.2.1 Basic ideaParticipatory sensing produces noisy sensor data due to the use of sensors with low accuracy or a mix of sensors with diverse performance capabilities. It is meaningless to analyze each value in the noisy sensor data in order to use it in applications. We have to estimate true values from the noisy sensor data to provide reliable data for applications. We recently proposed a method for statistically estimating the true values of population means by using noisy sensor data as random samples [9]. This estimation method is aimed at accurately estimating the population means while preserving their spatio-temporal patterns. This method can be used to accurately estimate a population mean by expanding a spatio-temporal region where a sample is obtained in order to increase the sample size. This is because of the well-known fact that an estimate for a population mean becomes more accurate as the sample size increases. However, expanding the region makes the spatio-temporal granularity of the estimate coarse, which leads to a loss of spatio-temporal patterns of the population means. This estimation method preserves those spatio-temporal patterns by the use of a constraint condition in which the region must consist of elements with the same population mean when the region is expanded. In other words, this estimation method partitions an entire spatio-temporal region into the largest possible regions, each of which consists of elements with the same population mean, and then estimates each population mean by using samples obtained in the regions. 4.2.2 Detailed steps of estimation methodThe above-mentioned estimation method consists of three steps: initialization, region expansion, and interval estimation. The region expansion and interval estimation steps are repeated until the entire spatio-temporal region is covered. An overview of this estimation method is shown in Fig. 5, where a spatio-temporal region is drawn as a simplified two-dimensional region.
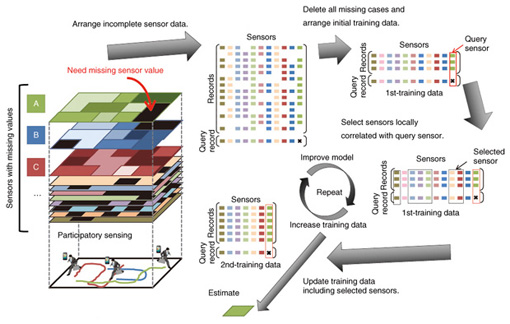
(1) Initialization In this step, the entire spatio-temporal region is divided into elements of the same size, which are united into regions in the region expansion step. (2) Region expansion In this step, one of the elements is randomly selected and added to a region, which is then expanded by uniting the neighboring elements with the same population mean. This step statistically tests the null hypothesis, which states that the population mean of the region equals that of each of the neighboring elements, against the alternative hypothesis. If the null hypothesis is accepted or not rejected, this expansion step basically adds each of the neighboring elements to the region. However, a statistical hypothesis test may produce a type II error, which is the incorrect acceptance of a false null hypothesis. Thus, this step adds each of the neighboring elements to the region with the statistical power, which is the probability of not making the type II error. In this way, this step adheres to the constraint condition that the region consists of elements with the same population mean when expanding the region. In this step, the region expansion with statistical hypothesis testing is repeated until no neighboring elements are newly added to the region, which maximizes the region under the constraint condition in order to increase the sample size for estimation. (3) Interval estimation In this step, a confidence interval is statistically estimated for the population mean by using a sample obtained in the expanded region. This ensures that applications can not only obtain a more accurate estimate but can also assess the accuracy of the estimate by the width of the interval. The above steps, particularly the region expansion step, allow us to achieve the intended aim of accurately estimating the population means while preserving their spatio-temporal patterns. 4.3 Missing value estimation4.3.1 Basic ideaIn participatory sensing, the sensor data are often affected by missing values, which makes the data incomplete. The sensors and sensing area respectively depend on the mobile devices of the participants and the participants’ trajectories. It is not feasible to force a participant to stay in a target area as a stationary sensor. Our goal was to accurately estimate the missing values of a sensor from incomplete sensor data by using multiple regression. A simple way of analyzing incomplete sensor data would be to delete all the missing records and then use only the complete records. However, excluding all records having more than one missing value would result in a decrease in the quantity of training sensor data available for estimation. Thus, we should select the minimum number of sensors needed to estimate the missing values and exclude all records that have missing values of the selected sensors. We previously proposed a method to estimate a missing sensor value by using incomplete sensor data [10]. This estimation method was designed to improve the regression model and increase the quantity of training sensor data. This method roughly prunes inessential sensors by using small training sensor data and improves estimation accuracy while repeating sensor selection and updating the training sensor data. An overview of this estimation method is shown in Fig. 6.
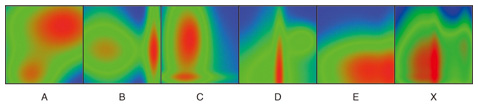
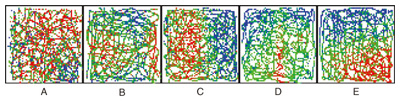
4.3.2 Detailed procedureLet Rinit be incomplete sensor data that consist of ninit records rinit,1, rinit,2, … , rinit,ni. Each record rinit,j ∈ Rinit has values of multiple sensors V, which may include some missing values. Here, rinit,j (v) is rinit,j’s value of the sensor v ∈ V. Given the incomplete sensor data Rinit as the initial training sensor data and a missing value Q(q) of a sensor q in one record Q as a query, we set the estimation task as estimating Q(q). Our estimation method consists of the following six steps: inputting incomplete sensor data and queries, maintaining training sensor data, conducting locally weighted measurements, selecting sensors, evaluating accuracy, and doing the final estimation. The steps from training sensor data maintenance to accuracy evaluation are repeated until the accuracy satisfies quality conditions. (1) Incomplete sensor data and query input This estimation method receives Rinit, which is detected through participatory sensing. The sensors initially selected for regression are set to be the observed sensors of the query record. (2) Training sensor data maintenance When arranging the training sensor data, our estimation method completely removes the records that do not include the selected sensors from the incomplete sensor data, then puts the remaining records in order. (3) Locally weighted measurement This estimation method weighs the nearest neighbor records for regression. This is for sensors that are not generally correlated but locally correlated. For example, illuminance and ultraviolet light are often correlated if the spatio-temporal range is limited. The weight is measured based on the selected sensors. This means that the weight of a record updates every correlated sensor selection. (4) Sensor selection This estimation method selects sensors correlated with the sensor that includes the missing value by using Lasso, which is an L1-norm regularization technique. Lasso does both continuous shrinkage and automatic variable selection at the same time. It is widely used in high-dimensional regression for variable selection. (5) Accuracy evaluation The estimation method determines whether it should continue the repeated steps. It stops repeating the steps when one of the following two conditions is satisfied. One is that the amount of training sensor data does not increase after sensor selection. This is because the accuracy would not be expected to improve. The other is that the accuracy measured by K-fold cross-validation satisfies the predefined threshold, which represents the mean squared error. If these conditions are not satisfied, it executes the steps from training sensor data maintenance to accuracy evaluation again. (6) Final estimation The final estimation value is then calculated. 5. DemonstrationWe developed a demonstration system to simulate participatory sensing and indicate the effects of our true-value and missing-value estimation methods described in subsections 4.2 and 4.3. In this section, we explain how the quality of participatory sensing data is improved by using our estimation methods with the demonstration system. Our demonstration scenario is to visualize the fused values of five types of participatory sensing values as a heat map. For the data collection, we assume that 100 people participate in sensing. 5.1 Simulation of participatory sensingWe prepared five synthetic datasets of sensors, A, B, C, D, and E, in a square area for the demonstration. Their heat maps are shown in Fig. 7. Red indicates a higher value and blue a lower value. The visualization target X is the sum of the five sensor values. We divide the 100 participants into five groups. Each group consists of 20 people and is assigned one of the five types of sensors. We assume that each sensor module has its own error rate, and participants walk around the area while capturing sensor data.
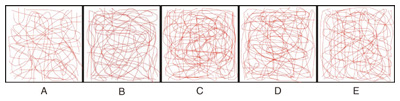
To simulate participatory sensing, each participant freely draws a curved line on the area instead of walking. The trajectories are shown in Fig. 8. The temporal axis is omitted from the simulation to simplify the heat maps, so all sensing actions of all participants are regarded as concurrent. The sensing results are shown in Fig. 9. Noise and missing values can be seen compared to the original data in Fig. 7.
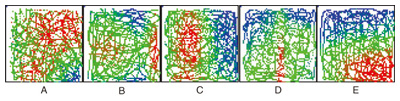
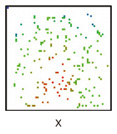
5.2 Effects of our two estimation methodsWe estimated the population means for each sensor. The results are shown in Fig. 10. The noise was reduced compared to the raw data in Fig. 9; however, there were still many missing values. Moreover, points where all kinds of data exist are very rare (Fig. 11). This means that it is impossible to calculate and visualize X on the map.
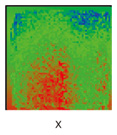
In this demonstration, we directly compensated for missing values of X instead of the values of each of the five sensors A to E. We estimated the missing values of X using other sensors’ values. These results are shown in Fig. 12. Although some errors remained, almost all of the data were compensated for.
6. ConclusionWe discussed participatory sensing and pointed out three defects that can occur in sensed data: sparseness, noise, and distortion. We also introduced three core techniques to enhance the quality of participatory sensing data. A demonstration showed that our enhancement techniques worked well. We believe that using our enhancement techniques in sensor virtualization environments will make it possible to support many useful applications that use real-world data. We are currently investigating ways to evaluate data quality and value and developing sample applications of participatory sensing. References
|
||||||||||||||||||||||