|
|||||||||||||||
|
|
|||||||||||||||
       |
Feature Articles: QoE Estimation Technologies Vol. 11, No. 5, pp. 21–24, May 2013. https://doi.org/10.53829/ntr201305fa5 QoE Assessment Methodologies for 3D Video ServicesAbstractTechnological advances in three-dimensional (3D) video enable users to watch 3D video content. However, watching such content may cause visual discomfort and fatigue. This article gives an outline of the relationship between 3D video degradation factors and quality of experience (QoE) and introduces QoE assessment methodologies and standardization activities.
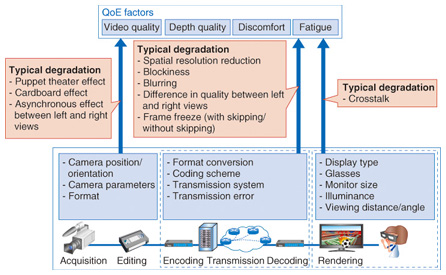
1. IntroductionUsers can now easily enjoy watching three-dimensional (3D) content on terminals such as 3D televisions (TVs), personal computers, and smartphones due to the recent advances made in these terminals. Video quality has also been improved by the introduction of high definition (HD). In addition, by introducing depth perception to video, 3D video gives a new experience to users. However, some users complain of visual discomfort and fatigue from watching 3D video. To provide high-quality 3D video content, it is important to design and manage services based on the quality of experience (QoE), and to do this, a 3D video QoE assessment methodology is essential. 2. 3D video QoEThis section describes QoE for 3D video services. The International Telecommunication Union, Telecommunication standardization section (ITU-T) Recommendation BT.2021 defines 3D video QoE in terms of visual quality, depth perception, and visual discomfort [1], [2]. As described in section 1, fatigue [3] from 3D video content is also an important factor. In this article, we define QoE in terms of visual quality, depth perception, discomfort, and fatigue. These QoE factors are affected by the 3D video processing chain, as shown in Fig. 1.
There are differences between the processing chain and the human vision system (HVS) in 3D video acquisition and display. For example, the position and angle of a camera do not match those of the human eyes. In addition, when a user views 3D video content, they see an image formed from two video images viewed separately by the left and right eye through stereoscopic glasses in the rendering phase of the processing chain. As a result, puppet theater*1, cardboard*2, and spatio-temporal asynchronous effects between the left and right views occur. Crosstalk*3 due to the stereoscopic glasses also occurs. 3D video is downsized and/or encoded in order to reduce the network bandwidth and the amount of storage needed. To use the existing infrastructure for codec and transmission, the spatial resolution of the left and right views, which are arranged in a side-by-side frame-compatible format, is usually down-converted by half in the horizontal direction to maintain the spatial resolution of a full high-definition (HD) 2D video sequence. The video is encoded by MPEG-2 (Motion Picture Experts Group-2) or H.264/AVC (advanced video coding) and is transmitted to a user terminal such as a set-top box. Finally, the side-by-side format video is decoded and up-converted to two full HD video signals for the left and right views. Thus, users perceive degradations in quality due to the reduced spatial resolution in addition to coding artifacts such as block noise. To prevent the degradation due to the reduced spatial resolution, the use of two full HD video signals for left and right views, which is called the frame-sequential format, is ideal. In this case, an H.264/MVC (multiview video coding) is often used, which involves an inter-view prediction technique that encodes the right-view video using both videos for left and right views in order to reduce the bit rate for the right-view video. With this system, service providers often encode the right-view video at a much lower bit rate than the left on the basis of binocular suppression. The two 2D video signals for the left and right views have full HD resolution, but they have an asymmetric quality in addition to coding artifacts such as block noise. Encoded 3D video is packetized and transmitted over a network such as an IP (Internet protocol) or terrestrial network. Packet loss sometimes occurs in networks. Block noise occurs if there is no packet-loss concealment (PLC) technique applied in the user terminal. In contrast, if a PLC technique is applied in the user terminal, freezing artifacts will be introduced when the PLC scheme of the receiver replaces the erroneous frames (either due to packet loss or error propagation) with the previous error-free frame until a decoded picture without errors has been received. This type of artifact is also called freezing with skipping. The rebuffering artifacts come from rebuffering events at the receiver, which could be the result of a stream arriving late. This type of artifact is also called freezing without skipping. Degradation perceptions may change due to the display size, room illuminance, viewing distance, and angle. Therefore, as mentioned previously, because 3D video QoE is affected by many factors, methodologies are needed to assess 3D video QoE.
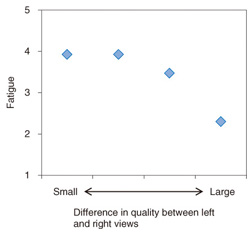
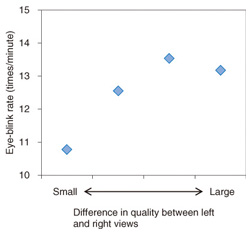
3. 3D video subjective assessment methodologySubjective assessment, in which users subjectively evaluate 3D video QoE, is a fundamental quality assessment technique. ITU-R Recommendation BT.2021 was standardized for the 3D video quality subjective assessment method. As described in section 2, it is important to develop methodologies that assess depth perception, discomfort, and fatigue since 3D video QoE is affected by these factors, in addition to visual quality. The Video Quality Experts Group (VQEG) is currently investigating subjective assessment methodologies concerning depth perception and discomfort. However, it is often difficult to evaluate discomfort and fatigue using questionnaire-based subjective assessment because the levels of these indicators are sometimes low in questionnaires. Therefore, it is important to supplement information obtained from questionnaires with biological information such as heart rate, breathing rate, pupil changes, and eye-blink responses when assessing discomfort and fatigue. Our group has investigated the relationship between fatigue and biological information. The relationship between fatigue and the difference in video quality between left and right views is shown in Fig. 2. In this figure, the lower the number on the fatigue axis, the greater the amount of fatigue; i.e., a value of 1 represents high fatigue, whereas 5 represents low fatigue. The relationship between the eye-blink rate and the difference in video quality is shown in Fig. 3. As shown in Fig. 2, fatigue score increases as the difference in video quality increases. As shown in Fig. 3, the eye-blink rate increases as the difference in video quality increases. These results suggest that fatigue can be evaluated using the eye-blink rate.
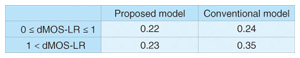
4. 3D video quality objective estimation methodologyDeveloping an objective quality estimation model that can be used to estimate QoE using information such as 3D video signals is essential for monitoring QoE. It is important to take into account the degradation factors described in section 2 in order to develop such a model. In principle, block noise, blurring, and freezing due to encoding and transmission also occur in 3D video services. Therefore, the 2D video quality objective estimation model can be applied to 3D video quality estimation. However, since quality degradation factors such as the difference in video quality between left and right views, the asynchronous effect between left and right views, and crosstalk do not occur in 2D video services, these factors need to be taken into account in 3D video quality estimation. Our group has been developing an objective quality estimation model that takes 2D video quality for left and right views, which is derived from a 2D video quality objective estimation model, as input. Video quality is denoted as a mean opinion score (MOS), where 2D video quality for the left view is denoted as MOS-L, 2D video quality for the right view is denoted as MOS-R, and the difference in video quality for left and right views is denoted as dMOS-LR (= ABS(MOS-L – MOS-R)). We compared the performance of our model with that of a conventional model used to calculate the average 2D video quality for left and right views. Table 1 lists the performance values of our model and the conventional model, i.e., the root mean square errors in the range of 0 ≤ dMOS-LR ≤ 1 and 1 < dMOS-LR.
The results show that our model can estimate 3D video quality in the range of 1 < dMOS-LR, more accurately than the conventional model can. VQEG is also investigating a 3D video quality objective estimation model and discussing a test plan that will be used to verify the validity of such future models. 5. ConclusionThe introduction of 3D video has enabled service providers to provide a new visual experience, e.g., depth perception, to users. However, some users have complained of visual discomfort and fatigue from watching 3D video. Therefore, it is important to clarify factors that affect QoE and to develop a model to estimate QoE in order to provide high-QoE 3D video. Our group has been investigating subjective assessment methodologies for 3D video quality and fatigue as well as an objective quality estimation model. We plan to propose our model to VQEG in the future. We will also develop subjective and objective quality assessment methods for QoE other than that for 3D video quality using biological information. We will promote the practical use of these methods, which will contribute to providing a safe and pleasant 3D video streaming service. References
|
||||||||||||||