|
|||||||||||||
|
|
|||||||||||||
       |
Feature Articles: Applications of Big Data Analytics Technologies for Traffic and Network Management Data Vol. 11, No. 11, pp. 23–28, Nov. 2013. https://doi.org/10.53829/ntr201311fa3 Traffic Management of Video Streaming ServicesAbstractThe use of video streaming services is becoming more widespread, and as a consequence, the traffic volume of these services is rapidly increasing over the broadband communication network. It sometimes happens as a rare event that many users will start using video streaming services almost simultaneously. This results in an explosive increase in the volume of traffic, which is observed in the network data. Users strongly desire video streaming services that provide clear and high-resolution images for the entire duration of the programs they are viewing. Thus, special attention must be paid to these services in the task of traffic management. In this article, we characterize the variation in the traffic volume of video streaming services based on the viewing activities of users, and we explain what knowledge is necessary to manage the traffic. Keywords: traffic management, VOD, traffic volume
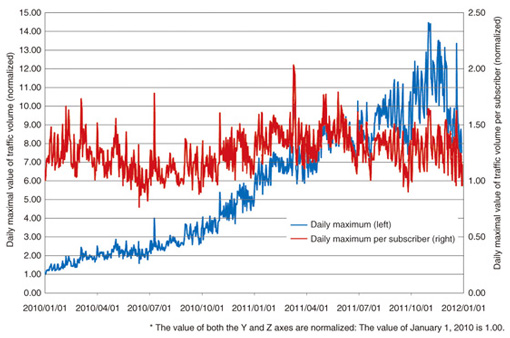
1. Introduction1.1 Traffic characteristics of video streaming servicesIn July 2011, Japan shifted to a digital terrestrial television (TV) broadcasting system. Around that time, the traffic volume of video streaming services began to increase rapidly over the broadband communication network. Video streaming services can be classified into Internet protocol (IP) multi-channel services and video on demand (VOD) services. With the former, a constant traffic volume can be maintained regardless of the number of users of a service because of the utilization of IP multicast. By contrast, the latter type increases the traffic volume in proportion to the number of users of a service because it delivers video content data according to the requests from users who want to view the video content. Therefore, in managing traffic on a broadband communication network, it is very important to accurately predict the traffic volume of the video streaming service and to dimension the amount of equipment necessary for offering the services. In this article, the term video streaming service indicates a VOD service. 1.2 SpikesA time series of the traffic volume of video streaming services during 2010–2011 is shown in Fig. 1. The Y-axis shows the daily maximam value of the traffic volume of the service. The daily maximam traffic volume per subscriber is shown by the Z-axis. Each axis is normalized by the value on January 1, 2010. The sudden peaks in the traffic can clearly be distinguished. We call these peaks spikes. We compared video streaming services with conventional communication services, for example, phone and Internet access services, and found that video streaming services have distinguishable features [1]. That is, their spikes have a special frequency and a relatively longer length. Here, we begin to explain the traffic characteristics and the background mechanism of video streaming services.
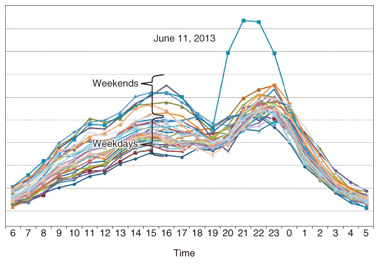
The traffic of a video streaming service in July 2010 is plotted in Fig. 2. The X-axis indicates a range from 6:00 a.m. to 5:00 a.m. the following day. Before explaining the spiky increases, we first explain the daily characteristics of the traffic volume of the video streaming service. The traffic volume is larger on weekends than it is on weekdays, so it is understood that this service is mainly used by home users rather than by businesses.
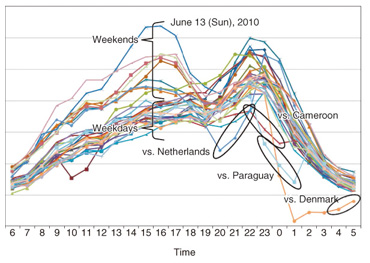
We can see that the busiest hour of the day, which refers to the period with the largest daily traffic volume of the service, is usually from 22:00 to 23:00 regardless of whether it is a weekday or weekend day. An exception is seen at around 16:00 on weekends, when the daily traffic volume reaches the highest peak. Some odd phenomena in the pattern of traffic can be seen. After the peaks in the early evening on weekends, the traffic volume begins to decrease until 19:00 or 20:00, then starts increasing until 23:00. This looks like an unnatural trajectory. These temporary decreases are special characteristics of the traffic volume of video streaming services. 1.2.1 Illustrative case 1Let us introduce some illustrative cases of spikes. At 20:00 on Sunday, July 11, 2010, the traffic volume of video streaming services began to increase suddenly. Note that the traffic volume had shown almost the same volume relative to ordinary weekends until 19:00. In fact, that day was the day of the House of Councillors election in Japan. At exactly 20:00, almost all Japanese TV stations simultaneously started broadcasting a special news report on the election results. TV stations usually broadcast TV programs in competition with other stations. There are various categories of programs, e.g., dramas, movies, music programs, live sporting events, educational programs, entertainment programs, cartoons, news, and special reports. Therefore, it is possible for people to choose a favorite TV program from the available TV programs whenever they want to watch them. On this occasion, however, people could not freely select their TV programs because all the TV stations were broadcasting the same content—the election news report. We can easily imagine that at this time, some people who were unconcerned with the election results, for example, children, could not find a TV program they wanted to watch, so they turned to video streaming services instead. From this illustrative case, a relationship appears between the traffic volume of video streaming services and TV programs being broadcast at that time. 1.2.2 Illustrative case 2Now we explain a reverse example to support the relationship of illustrative case 1. A 24-hour graph of the traffic volume of a video streaming service in June 2010 is shown in Fig. 3. During that month, the FIFA (Fédération Internationale de Football Association) World Cup games were being held in South Africa.
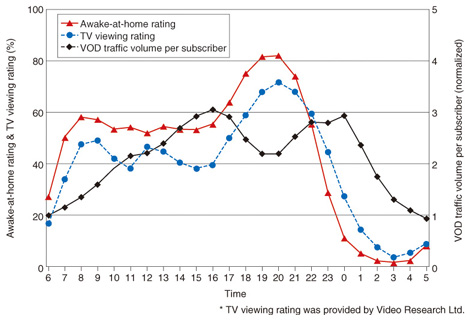
When the matches of the Japanese national team were broadcast live on TV, the traffic volume of video streaming services was substantially reduced in comparison with the same time on other days that month when the Japanese team was not playing. The presumption is that even heavy users of video streaming services were refraining from using streaming services at that time so that they could watch the match live on TV and cheer for the Japanese national team. As expected, we can see that there is a strongly competitive relationship between TV broadcasting and video streaming services. 2. Human life activitiesHere, let us explain the characteristics of the traffic volume of video streaming services in connection with people’s activities in their daily lives. Our research is based on the Survey on Time Use and Leisure Activities (2006) conducted by the Statistics Bureau, Ministry of Internal Affairs and Communications [2]. This survey aims to obtain comprehensive data on the daily patterns of time allocation and on leisure activities. The survey was first carried out in 1976 and since then has been conducted every five years. In the survey, the enumerators deliver questionnaires to each household to be surveyed, collect the completed questionnaires, and interview the households as necessary. The questionnaires are completed by household members 10 years old and over or by the head of the household. The participants also answer questions from the enumerators. To grasp the distribution of time use during a 24-hour period, each household member is requested to classify his/her own activities into 20 categories (1. Sleep, 2. Personal care, 3. Meals, 4. Commuting to and from school or work, 5. Work, 6. Schoolwork, 7. Housework, 8. Caring or nursing, 9. Child care, 10. Shopping, 11. Moving (excluding commuting), 12. Watching TV, listening to the radio, reading newspapers or magazines, 13. Rest and relaxation, 14. Study and research (excluding schoolwork), 15. Hobbies and amusements, 16. Sports, 17. Volunteer and social activities, 18. Social life, 19. Medical examinations or treatment, 20. Other activities). For these activities, we define an awake-at-home rating as the sum of the ratings of the activities being done at home except for category 1, Sleep. A 24-hour time series of an awake-at-home rating, TV viewing rating [3], and traffic volume per subscriber of video streaming services of Sundays average from 6 a.m. to 5 a.m. the following day is plotted in Fig. 4. We can see that the TV viewing rating has almost the same shape as the awake-at-home rating. In fact, when many people come home, one of the first things they do is turn on the TV. Then they continue watching TV, or just leave the TV on, while they are eating dinner or doing housework. Finally, they turn the TV off just before going to bed. Such a custom is considered to be normal, so this relation between the two ratings is easily understood. In addition to the TV viewing rating, the awake-at-home rating also peaks at around 20:00.
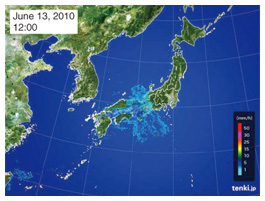
In the field of TV broadcasting, this time occurs during the period called the prime time in Japan (19:00–22:00). TV broadcasting companies produce TV programs such as dramas or entertainment programs by assembling casts of popular TV celebrities and actors/actresses in order to achieve a higher TV viewing rating than others. These broadcasting companies are always strongly motivated to broadcast TV programs that are expected to achieve higher TV viewing ratings leading into the prime time because the aim of their business is to obtain higher advertising revenues. 2.1 Relation to TV broadcastingHere, let us consider the relation between video streaming services and TV broadcasting. The traffic volume of the former has a characteristic in which it temporarily decreases at around 20:00. As mentioned previously, 20:00 is the prime time in the TV broadcasting business when all TV channels are broadcasting programs that are more popular than video streaming services. This is the same as the case of the FIFA World Cup. In Fig. 4, it is shown that the traffic volume of video streaming services increases on Sunday afternoons. The quality of TV content being broadcast at this time is perceived to be lower than at other periods, so many subscribers feel that video content is more interesting than regular TV programs. In fact, at this period of time, many TV channels are rebroadcasting previously aired TV programs. 2.2 Relation to awake-at-home ratingHere, we discuss the relation between video streaming services and the awake-at-home rating. The attractiveness of TV programs is often assumed to be at a constant level throughout the day. In this situation, it is considered a natural trend that if the awake-at-home rating increases, then the utilization and traffic volume of video streaming services also increase. What would cause the awake-at-home rating in the daytime to be the highest on weekends, as shown in Fig. 3? It is clear from this figure that the day the traffic volume of the video streaming service was highest was June 13th, which was a Sunday. An image of a rain cloud at 12:00 on that day is shown in Fig. 5 [4].
The rain cloud was positioned over the middle of Honshu Island, and it brought rain to the western part of Japan in the morning. Then this cloud brought rain to the eastern part of Japan in the afternoon [5]. We presume this is the reason June 13th had the highest traffic volume among weekdays and weekend days that June. Such weather triggers of video streaming services occur not only with rain but also with decreasing temperatures. Both typhoons in summer and cold spells in winter produce this effect. It is well understood that weather conditions lead subscribers to stay indoors and that an increasing awake-at-home rating generates demand for video streaming services. 3. Future prospects in traffic researchIn this article, we introduced the traffic characteristics of video streaming services and explained why the traffic variation has the shape described above. Furthermore, it has been derived theoretically and verified from data that the traffic volume of video streaming services per subscriber obeys a lognormal distribution. The techniques described here are now ready to be investigated as on-site applications of the operating companies of the NTT Group. It is expected that a great variety of services will be offered over the broadband communication network in future. It is therefore important to analyze and understand the unknown traffic characteristics of such services in order to manage the traffic appropriately. We are beginning to apply the big data approach in order to acquire more detailed knowledge of traffic. Therefore, we are utilizing not only the traffic data that are measured inside networks but are also acquiring large amounts of information that exist beyond networks such as the weather information mentioned above, TV programs, TV viewing ratings, and awake-at-home ratings. References
|
||||||||||||