|
|||||||||||||
|
|
|||||||||||||
|
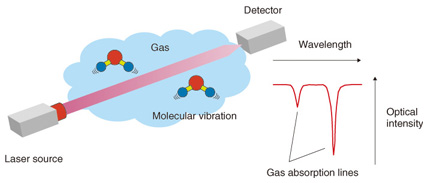
Feature Articles: Cutting-edge Device and Materials Technologies for Creating New Business Vol. 12, No. 4, pp. 45–50, Apr. 2014. https://doi.org/10.53829/ntr201404fa7 Highly Sensitive Laser Based Trace-gas Sensor Technology and Its Application to Stable Isotope Ratio AnalysisAbstractLaser based trace-gas sensor technology has been used in various fields such as greenhouse gas monitoring. It has attracted a lot of attention in recent years due to its use in stable isotope analysis. This form of analysis is expected to have many applications, including verifying the geographic origin of food and determining the emission sources of greenhouse gases. These applications are promising for their role in overcoming various social problems. Keywords: laser-based trace gas sensor technology, isotope analysis, semiconductor laser  1. IntroductionLaser based trace-gas sensor technology [1] has attracted a lot of attention because it is an extremely effective tool for detecting and quantifying gases such as carbon dioxide and methane with a view to reducing global warming and air pollution and contributing to a safe and secure society. NTT Photonics Laboratories has been developing laser light sources for gas sensing along with the corresponding application technology, which are expected to be useful in resolving various social problems. The principle of laser based trace-gas sensor technology is illustrated in Fig. 1. Gas molecules absorb the energy of light at a particular wavelength and generate molecular vibration. These molecules can absorb many light wavelengths, which are called absorption lines because the wavelengths are very narrow. When we sweep the wavelength of a laser light whose emission wavelength is about the same as the absorption line of the gas to be measured, we find a dip around the absorption line in the detected light power, as shown in Fig. 1. We can find the type and density of the gas to be measured from the position (wavelength) and the depth of the dip. This is the fundamental principle of laser based trace-gas sensor technology.
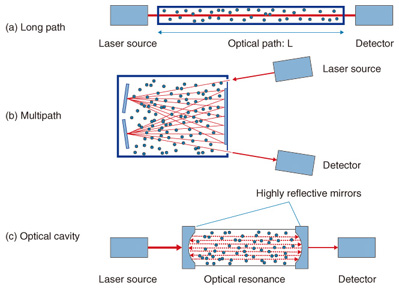
2. Technology to increase sensitivity of laser based trace-gas sensorsOne of the most important advantages of laser based trace-gas sensor technology is that it is highly sensitive compared with other sensor technologies. We describe in this section the factors that increase the sensitivity of laser based trace-gas sensors. One of the simplest ways to increase sensitivity is to lengthen optical path L. This is the path by which the laser light passes through the gas to be measured, as shown in Fig. 2(a). This method is often used in open path measurement techniques such as remote sensing. One problem, however, is that the apparatus becomes too large for L to be lengthened because most conventional trace-gas sensors have gas cells inside them. Therefore, the limit for this method is usually from tens of centimeters to several meters. Another method is shown in Fig. 2(b). We can increase the sensitivity and reduce the size of the apparatus by using a multipath cell. The laser light enters the gas cell and is reflected many times by mirrors that are located at either end of the cell. The light then exits the cell and is sensed by a detector. We can obtain a long effective light path of tens to hundreds of meters with a gas cell whose actual length is less than 1 m if we use multiple (from a few dozen to several hundred) reflections. Another method that uses an optical cavity is shown in Fig. 2(c). This approach greatly improves sensitivity and has attracted a lot of attention in recent years. Several techniques fall into this category, including cavity ring-down spectroscopy (CRDS) [2] and cavity enhanced absorption spectroscopy [3]. This method utilizes optical resonance with highly reflective mirrors and traps laser light in a cell. We can obtain a very long effective light path that exceeds several kilometers by using optical resonance.
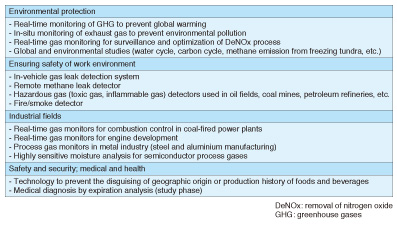
3. Application of laser based trace-gas sensor technologyLaser based trace-gas sensor technology is useful in various fields. Application examples in which NTT’s laser technology is used are listed in Table 1.
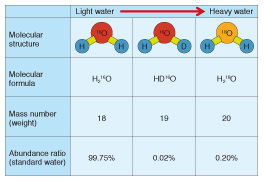
Greenhouse gas monitors designed to help prevent global warming are representative examples. Many global organizations including the World Meteorological Organization and the Japan Meteorological Agency use laser based trace-gas sensors because of their many advantages such as providing quick, highly sensitive measurements with high resolution. Furthermore, they make it possible to reduce operating costs because they are easier to calibrate and maintain than conventional monitors. Hazardous gas detectors that ensure a safe and secure work environment are another important example. Laser based trace-gas sensors can detect a small amount of hazardous gas even if its source is far away. Therefore, they are often used for detecting toxic gases such as hydrogen fluoride and hydrogen sulfide or inflammable gases such as methane in oil fields or coal mines. Furthermore, laser based trace-gas sensors have another important advantage in that they are more compact than other analyzers with the same high level of performance. Therefore, they are also used as portable sensors, for example, as a portable remote methane leak detector [4] and an in-vehicle gas leak detection system [5], which enables us to investigate gas leaks while driving a vehicle. These detectors have been used for inspection work by gas companies. High-precision isotope analyzers have been developed using highly sensitive laser technology such as CRDS, and they have attracted increased attention in recent years. Stable isotope ratio analysis has been used for a long time in various fields including earth science, environmentology, and archaeology because it is a useful technology for detecting or estimating the origin of a material. However, it is necessary to use large analytical equipment such as an isotope ratio mass spectrometer or a nuclear magnetic resonance spectrometer, which require a large laboratory room and a complicated operating procedure. This creates difficulties in expanding the areas of application. Newly developed laser based isotope analyzers have many advantages including a more compact size and excellent portability and operability, and we can therefore expect the application fields of stable isotope analysis to expand greatly. 4. Stable isotope analysis of water and determination of geographic origin of foodMany atoms have different mass numbers, which indicate the weight of the atom, despite being atoms of the same element and having the same number of protons. These atoms are called isotopes. A lot of information can be obtained about the origin of a material if we can precisely measure its isotope ratio. In this section, we give a concrete example of how the geographic origin of a water sample can be determined. The molecular formula of water is expressed as H2O. This formula means that a water molecule consists of two hydrogen atoms (H) and one oxygen atom (O). The mass numbers of most hydrogen and oxygen atoms are 1 and 16, respectively. Therefore, the molecular formula of most water molecules can be expressed as H216O, which means it consists of two hydrogen atoms whose mass number is 1 (H) and one oxygen atom whose mass number is 16 (16O). However, since there is also an isotope of hydrogen called deuterium whose mass number is 2 (D), as well as an isotope of oxygen whose mass number is 18 (18O), there are isotopic water molecules that include these isotopes (DH16O and H218O), although their abundance is low (see Table 2). The abundance ratios of these isotopic water molecules are closely related to their geographic origin [6]. Since DH16O and H218O are slightly heavier molecules than H216O, we call water with a relatively high content of these isotopic water molecules heavy water, and that with a low content light water. The rainwater that falls in hot areas, for example tropical regions, is known to be heavy water, whereas the rain or snow that falls in cold areas, for example, the polar regions, is light water. The origin of river water and groundwater is rainwater. Animals and plants consume the rainwater that falls in the region they inhabit. Therefore, their oxygen and hydrogen isotopic ratios are related to those of the rainwater that falls in the region. We can therefore expect to apply isotope analysis technology to determine or estimate the geographic origin of foods and beverages.
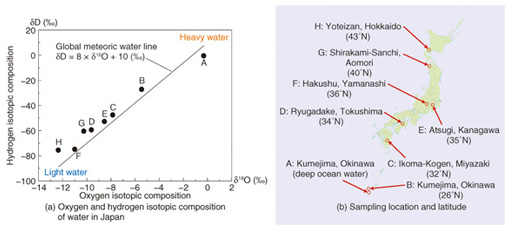
We measured the isotope ratios of eight types of water available in Japan: seven bottled waters sampled from various places in Japan, and one tap-water sample from Atsugi, the location of our laboratory, using a laser based water isotope analyzer. The measurement results are shown in Fig. 3(a), and the sampling locations and their latitudes are in Fig. 3(b). The horizontal axis indicates the oxygen isotopic composition δ18O, and the vertical axis indicates the hydrogen isotopic composition δD in Fig. 3(a). The isotopic composition is usually denoted δ, as defined by the following equation: δX (‰) = ( Rsample/Rstandard – 1 ) × 1000 where X represents 18O or D, and R represents the isotope ratio of each element, that is, 18O/16O or D/H for oxygen or hydrogen, respectively. The isotopic composition δX is defined by the difference between the isotope ratio of the sample (Rsample) and the standard material (Rstandard), and is expressed in per mille units (‰), as shown in the above equation. For oxygen and hydrogen, Vienna Standard Mean Ocean Water (VSMOW), which is managed by the International Atomic Energy Agency, is usually used as the international standard material. The solid line in Fig. 3(a) indicates the Global Meteoric Water Line, which gives the average relationship between hydrogen and oxygen isotopic compositions in natural terrestrial waters, expressed as a worldwide average.
Although A and B are both examples of water sampled in Kumejima, Okinawa, there is a big difference between them. A is deep ocean water, and B is spring water sampled on the island. Since VSMOW was composed of ocean water collected from different locations around the globe as the standard mean ocean water, the oxygen and hydrogen isotopic compositions (δ18O, δD) of the deep ocean water A are both nearly zero. We denote the lower to higher latitude order as B to H. We found that as the latitude of the sampling place became higher, the isotopic composition became lower, with two exceptions, namely Ryugadake, Tokushima (D) and Hakushu, Yamanashi (F). We believe this is because the water sources are at a higher altitude than in the other locations. The isotope ratio of precipitation is related to the geographic characteristics because light water molecules are easier to vaporize and harder to condense than heavy water molecules. Therefore, the water molecules in the atmosphere are lighter than those in the ocean. First, the relatively heavy light-water molecules in the atmosphere condense into liquid water and cause rain in hot regions near the equator, and then, the water molecules, which become lighter and lighter, move to colder regions and condense and bring light rain or snow. The oxygen and hydrogen isotope ratio of the water is closely related to such geographic information as the latitude and altitude of its source, and we can expect to determine or estimate the geographic origin of different types of water by using this property. Furthermore, the isotope ratio of water affects that of the material composition of animals and plants, which consume the rainwater that falls in the region. Therefore, a lot of research has been done on the use of isotope analysis technology to detect the geographic origin of various foods including agricultural and livestock products. The material composing food contains not only oxygen and hydrogen but also carbon and nitrogen, so we can also measure the isotope ratio of carbon or nitrogen to achieve a more precise determination. For instance, the carbon isotopic composition (δ13C) is known to be related to certain species of plants and their growing environment or the kind of feed used for livestock. Therefore, it is also useful for determining or estimating the geographic origin of food. 5. Future developmentsWe have mainly focused in this article on the use of isotope analysis technology to determine the geographic origin of food, but we can also expect this technology to be applied to various other fields including quality inspection of manufacturing methods, the production history of food (e.g., as a screening method to reveal the adulteration of honey or fruit juice with lower cost sweeteners and for discriminating between straight fruit juice and concentrated fruit juice), and the determination of the source of greenhouse gases such as carbon dioxide (e.g., fossil fuels, biomass, animal exhalation), which will be a very useful technology for maintaining food safety and improving the global environment. NTT Photonics Laboratories will promote the research and development of laser source technology and its corresponding application technology in line with efforts to resolve various social problems. References
|
|||||||||||||