|
|||||||||||
|
|
|||||||||||
       |
Feature Articles: Interdisciplinary R&D of Big Data Technology at Machine Learning and Data Science Center Vol. 14, No. 2, pp. 14–20, Feb. 2016. https://doi.org/10.53829/ntr201602fa2 From Multidimensional Mixture Data Analysis to Spatio-temporal Multidimensional Collective Data AnalysisAbstractThis article introduces a multidimensional mixture data analysis technique that can efficiently extract significant features that transect different types of data with multiple attributes such as application logs available on the Web and sensor data collected from IoT (Internet of Things) sensors. The basic algorithm and an example of an application to review site data analysis are described. Spatio-temporal data modeling and an extension of a spatio-temporal multidimensional collective data analysis technique for predicting the time and place of near-future events are also explained. Keywords: data mining, machine learning, spatio-temporal analysis
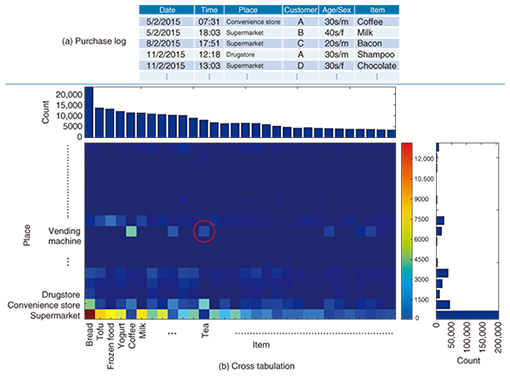
1. IntroductionAs the use of e-commerce sites, smartphone apps, the Internet of Things (IoT) devices, and other such services and devices increases, various types of data related to the behavior of people and the movement of things are being generated. For example, the purchase log of an e-commerce site includes data such as the product item purchased, the time and place, and the customer age group and gender. Characteristic customer class and product groups are extracted by analyzing the huge amount of accumulated data (Fig. 1(a)). Another recent trend is application programs, mainly for smartphones, that obtain user location data from GPS (Global Positioning System), Wi-Fi, and beacons with user consent. Combining such location data with the purchase log information described above enables finer analysis that includes more details concerning the purchase circumstances, such as whether the purchase was made while the purchaser was out or at home. Previous methods for extracting such customer classes and product groups have used cross tabulation, which, for example, aggregates the number of items sold for each combination of place and product, and represents the results in table format or as a matrix (Fig. 1(b)). The type of shop and the product item are referred to as attributes or axes. In the example shown in Fig. 1, there are two attributes (place and item), so the data are said to have two axes. The attributes can have various values because the place may be a supermarket, convenience store, or other shop, and the items might be coffee, tea, or another product. From the aggregation results, it is possible to determine the trend in a single attribute value, such as what items have high sales numbers for a particular place, or the places where a particular item is sold. However, the results become more complex as the number of possible attribute values increases. Because the data focus on combinations that have high aggregate numbers, it is difficult to extract features such as “Sales of black tea are relatively high, even for vending machines,” as indicated by the red circle in Fig. 1(b).
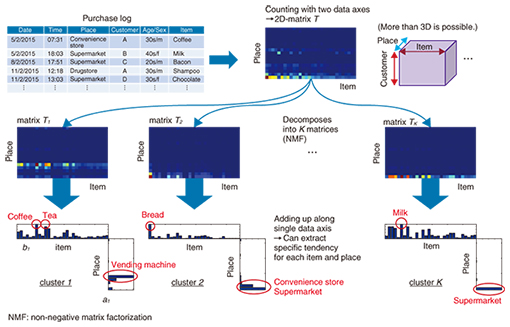
2. Multidimensional data analysisOne way to overcome the problem described above is multidimensional data analysis, in which a matrix that represents two-dimensional aggregate data is decomposed to the sum of K matrices (Fig. 2). The data represented by the K individual matrices T1 to TK are called clusters. The aggregate values of individual clusters obtained by multidimensional data analysis are biased toward a particular place or item, so it is easier to identify trends in individual clusters. For example, the items that are often sold in vending machines can be extracted in cluster 1; cluster 2 reveals that most bread is sold in supermarkets, and only about half that amount is sold in convenience stores; and cluster K indicates that the top item in supermarket sales is milk.
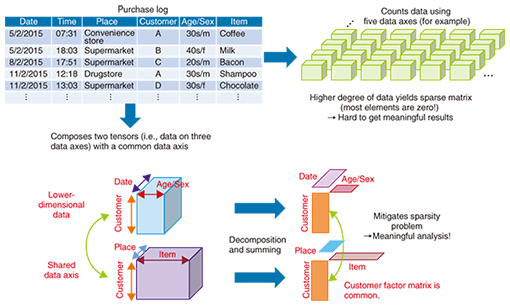
Our concern here is the method used in matrix decomposition. We take the original aggregate data as an I × J matrix T and decompose it such that it can be approximated as the sum of K matrices T1 to TK (T ≅ T1 + T2 +…+ TK). In the example described above, I is the number of places and J is the number of items. In that case, the individual matrices that result from the decomposition, Ti (i = 1 ... K ), are also I × J matrices. Although the way the matrix is decomposed is arbitrary, multidimensional data analysis decomposes the original matrix so that each resulting matrix Ti (i = 1 ... K ) is the product of I × 1 column vectors ai and 1 × J row vectors bi (Ti = ai × bi), where we impose the constraint that the elements of each vector take non-negative values (0 or higher). The above decomposition can then be written as T1 + T2 + …+ TK = a1 × b1 + a2 × b2 + ... + aK × bK = (a1 a2 ... aK) × (b1 b2 ... bK) = A × B. This is nothing other than an approximation of the original I × J matrix T as the product of I × K matrix A and K × J matrix B (T ≅ A × B ), where K is much smaller than I and J (K << I, J). Matrices A and B, which are called factor matrices, are obtained by initially setting their elements to random values and then reconstructing them such that A × B = T’, where the factor matrices A and B are updated so as to minimize the error between T’ and the original matrix T. This process is repeated until the error value converges and the final factor matrices A and B are obtained. In the analysis example described above, A is the factor that corresponds to place, and B is the factor that corresponds to item. This method is a machine learning technique referred to as non-negative matrix factorization (NMF) and is commonly applied in data mining [1]. This approach can also be applied to high-dimensional data (tensors) that involve three or more attribute values, in which case it is referred to as non-negative tensor factorization (NTF). 3. Extension to multidimensional ‘mixture’ data analysisNTF can be used to extract latent features from data by decomposing a matrix (tensor) of data that aggregates various attribute combinations into the product of factor matrices. However, as variation in the attribute values increases, bias in the aggregate data is more likely to develop. Analyzing aggregate data to which a new attribute (user age group) is incorporated in addition to place and item attributes would make it possible to extract customer clusters that indicate trends based on user class, place, and purchased item. Nevertheless, the number of attribute combinations increases explosively as the number of attributes increases and the data become sparser, meaning that the aggregate values for most of the combinations are zero. The data aggregation for the case in which the purchase log shown in Fig. 1 involves four attributes (axes) comprises 240 million value combinations (e.g., 24 time values, one for each hour of the day × 100 place values × 1000 users × 100 products). Although it depends on the type of data, 99.9% of the elements for combinations of four or more attributes actually become zero. That is to say, less than 0.1% of all of the elements in the aggregate data have non-zero values, and it is difficult to obtain satisfactory results from factor analysis of such extremely sparse aggregate data. NTT laboratories have developed non-negative multiple tensor factorization (NMTF) as a solution to mitigate the sparseness problem. Instead of aggregating the original data as a high-dimensional tensor (five dimensions in this case), this approach constructs multiple tensors or matrices that represent non-sparse aggregate data (having mostly non-zero elements). The attributes (axes) are reduced to three or fewer, and the analysis is performed assuming that factor matrices share common attributes among multiple tensors or matrices (e.g., the customer axis in Fig. 3). Because multiple items of aggregate data are combined for the multidimensional analysis, this method is referred to as a multidimensional mixture data analysis technique.
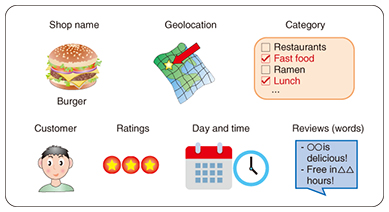
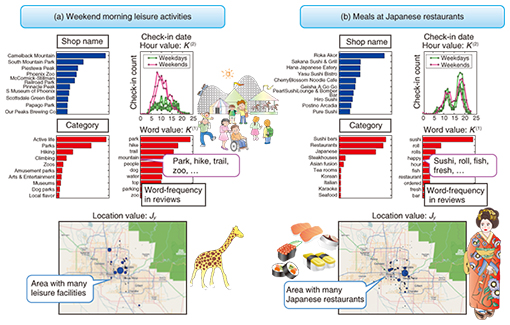
4. Example using a Yelp data setTo evaluate the effectiveness of multidimensional mixture data analysis with NMTF, we applied it to an open data set collected by the Yelp review site in the United States (Fig. 4). Yelp data are available for research purposes [2] and contain a variety of review information on commercial facilities in the form of attributes, including the shop name, category, location, customers, rating, terms used in reviews, and day and time of check-ins, which provide customers’ self-reported location via social networking service applications. From such data, it is possible to aggregate the following three types of tensor data, for example.
(1) Review tensor: user × shop × day of the week. The value is the number of reviews. (2) Check-in tensor: shop × time × location (longitude and latitude). The value is the number of check-ins. (3) Term frequency tensor: user × category × term. The value is the term-frequency of each word that appears in a review. The tensors have the user and shop axes in common. By applying NMTF for the three tensors described above, we can obtain significant clusters that capture features with many attribute combinations such as “Weekend morning leisure activities” and “Meals at Japanese restaurants” (Fig. 5). From these clusters, it is possible to obtain results for areas where there are many facilities or restaurants, the day and time period when facilities are most often used, the geographic distribution, and the terms often used in reviews. The details of the analysis algorithm and results are presented in a published study [3]. In this way, NMTF can efficiently extract significant clusters from data with multidimensional attributes while mitigating the sparseness problem.
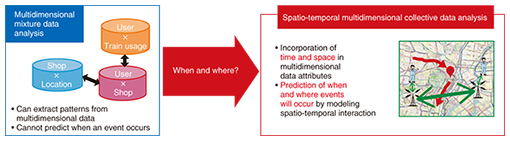
5. Future developmentAlthough multidimensional mixture data analysis by NMTF can efficiently extract latent feature clusters from data, other factors such as the temporal cause-and-effect relationships among the elements of aggregated data or the spatial adjacency are not taken into account. In particular, the analysis of location data for users and vehicles can be based on an area divided into a spatial mesh and the number of persons and vehicles observed in each time period. However, even when NMTF is applied to such data, it is not possible to obtain analysis results that predict the times at which events such as congestion will occur in the future. For that reason, we plan to push forward with the development of innovative spatio-temporal multidimensional collective data analysis techniques that enable modeling of the temporal relationships of multidimensional data and prediction of future events. Spatio-temporal multidimensional collective data analysis considers four data aspects (time, space, multidimensional, and collective) for the purpose of gaining insight on near-future events (Fig. 6). The collective aspect is for estimating the spatio-temporal flow of people or traffic in cases where individuals cannot be recognized, such as when counting the number of persons or vehicles in a spatial mesh and only aggregate statistical data are available.
Looking toward 2020, we will continue with research and development on the use of spatio-temporal multidimensional collective data analysis techniques and real-time observation data to predict near-future events such as congestion in order to implement proactive navigation to relieve congestion at large-scale event venues [4]. We will also investigate how this research can be applied to stabilize the communication infrastructure. References
|
||||||||||