|
|||||||||||
|
|
|||||||||||
       |
Feature Articles: NTT Group Activities in the Agricultural Field Vol. 14, No. 6, pp. 13–18, June 2016. https://doi.org/10.53829/ntr201606fa2 Efficient Operation and Management of Agriculture through Visualization of the Production EnvironmentAbstractOne of the primary efforts to use information and communication technology (ICT) in the agricultural sector is for visualization of the production environment. Traditional production techniques rely on intuition and experience, but visualization of the data of the production environment and working conditions makes it possible to manage work effectively and to achieve more efficient production management. This is expected to lead to improved quality and increased yield. Production information is being further utilized through increased cooperation with sales and distribution departments and in the areas of environmental control and prediction. This article introduces the system mechanisms and the use cases for information utilization by ICT as part of efforts to realize efficient and stable agricultural management. Keywords: agriculture, production, ICT
1. IntroductionWith the rapidly aging and declining number of farmers and an increase in the area of cultivated land that has now been abandoned, there is a need to change production methods in Japanese agriculture. To achieve the sustainable development of agriculture, it is necessary to introduce cutting-edge technologies such as those that can help to expand the size of individual farming units, reduce labor requirements, and cut costs. Also needed are technologies that make production adaptable to demand and enhance added value, and technologies that mitigate the risks around abnormal weather. Steps are being taken to implement these technologies in order to reform production and distribution systems [1]. There are greater expectations that information and communication technology (ICT) will play a major role because it serves as the foundation for these technologies. The government’s agricultural ICT strategy for promoting creation and distribution of agricultural information, part of its plan to become the world’s most advanced information technology (IT) nation [2], advocates the active use of IT in agriculture. Use of information made possible by ICT can contribute to strengthening the industrial and international competitiveness of Japan’s agriculture. In the field of agricultural production, initiatives have been introduced to ease the transition from management that involves simply relying on intuition and experience to efficient management and operation based on ICT in order to achieve higher product quality and greater profitability. Among these activities, the one that is rapidly bearing fruit is visualization of the production environment. 2. Visualization of the production environmentIn the field of production management, a lot of labor and time is consumed in order to obtain visual images of plant conditions and the production environment. Visualization of the production environment using ICT enables users to obtain data on the environment and working conditions in real time. By checking and analyzing data, farmers can improve production management and operation efficiency, resulting in better product quality and increased crop yields. A wide variety of services based on different sensor network technologies and cloud services targeting different types of farmland have been developed and introduced. The first step in implementing visualization is to install sensors and cameras in fields and collect data automatically. In the case of vinyl greenhouses, temperature, humidity, the amount of solar radiation, CO2 level, the electrical conductivity (EC)* of soil, pH level, and the amount of water can be measured using sensors that are suited to the particular crop. Data are stored in servers in a cloud via a network such as a 3G (third generation) mobile phone network or an optical network. Users can check the collected data anytime or anywhere using smartphones, tablets, or computers. In this way, they can obtain environmental data and the growth status of crops in different fields in real time. Also, various convenient cloud services are available for processing and displaying the stored data. Conventionally, users who wanted to monitor their production environment faced the problem of huge initial and ongoing operational costs because they had to own and manage their own computers. The advent of cloud services has reduced these costs dramatically and led to the widespread use of ICT in the area of production. Cloud services that store information about fields and daily farm activities are also available. In Japan, the larger the total area of a farm tended by a single farmer, the more scattered his/her individual fields tend to be, which adds to the amount of labor and time required for managing the farm. Visualization of the production environment is therefore an essential tool for expanding the sizes of farms without increasing labor and costs.
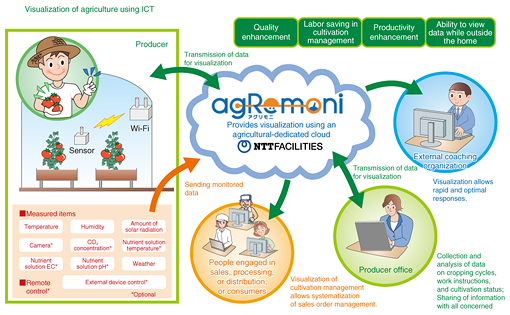
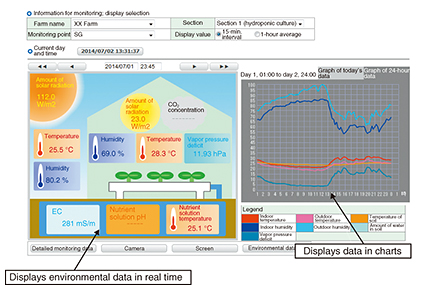
3. Production management using agRemoni, an agricultural management support systemNTT FACILITIES is building on its monitoring and environment construction (including facility operation) technologies developed in the fields of construction and energy and providing an agricultural production management service. This is a cloud-based service designed to turn existing greenhouses and appliances into smart agricultural facilities. Specifically, with our agriculture management support system called agRemoni, we are expanding the capabilities of this cloud service to support, in particular, facility construction, environmental monitoring, and optimal use of energy. The agRemoni system collects data on temperature, humidity, and the amount of solar radiation fields are exposed to, and stores the data in a cloud via the Internet using mobile phone or optical network access (Fig. 1). Users can easily view the collected data using their smartphones or tablets (Fig. 2). If any value exceeds a preset threshold, an alert is emailed to users, enabling them to respond quickly even if they have many greenhouses.
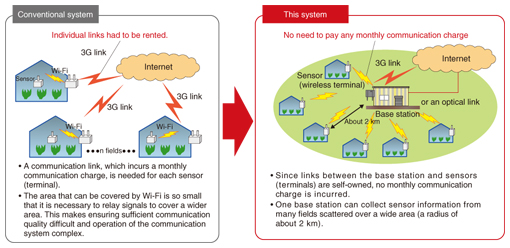
In addition to the above monitoring capability, the system supports maintenance of an optimal farming environment by providing functions for farm schedule management, recording of daily work reports, monitoring of crop growth, sending an alert in the event of abnormal conditions, and integrated management of data related to crop growth. 4. Low-cost monitoring of multiple fields scattered over a wide areaWhile visualization of the production environment is gradually being adopted, there are still some barriers for existing small- and medium-sized producers regardless of how motivated they might be. One major stumbling block is the communication cost. Fields are often far from the farmer’s residence and may consist of multiple plots scattered over a wide area. To monitor the production environment of every field, it is necessary to establish a communication link with every single field. Ordinary Wi-Fi cannot cover a wide area, and the use of 3G or other mobile phone links is costly, especially when there are many fields to monitor. A solution to this problem is a 920-MHz wireless sensor network, which allows communication over a relatively long distance (Fig. 3). Using this technology, farmers can build their own wireless wide area networks (WANs). Since there is no need to subscribe to communication links, this setup can reduce both the initial and the ongoing running cost.
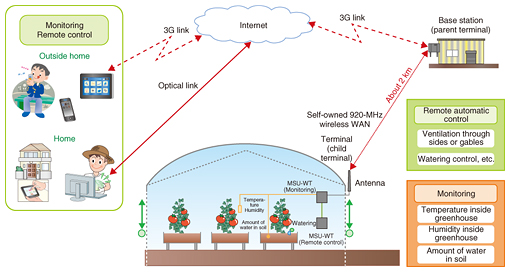
5. Test to ascertain the feasibility of monitoring and controlling the production environment using a self-owned wireless WANNTT FACILITIES is conducting a test to assess the feasibility of remote monitoring and control of the production environment using a self-owned wireless WAN as part of a project [3] commissioned by the Ministry of Agriculture, Forestry and Fisheries. The test continued until the end of March 2016. The test was being conducted in Fukushima Prefecture, where many farmers were adversely impacted by the Great East Japan Earthquake and were compelled to move to temporary housing. They have to commute to their fields, far from where they are living, which means that they need to spend a long time just for travel and cannot respond quickly to changes in the weather. This feasibility test, which targets small- and medium-sized producers, provides these farmers with capabilities to collect environmental data from remote fields and to control them remotely. The objectives are to enable construction of an optimal greenhouse culture environment, reduce labor, and maintain/improve product quality. Mechanisms for remote monitoring and simple environmental control using 920-MHz wireless links have been introduced into the fields (Fig. 4). This is the first time that a self-owned 920-MHz wireless WAN has been applied to agriculture. The technology for this network was provided by NTT Electronics, a partner in this test. The use of this wireless system developed by NTT has made it possible for a single base station to cover a number of fields, which can be up to 2 km away from the base station. The equipment at both the base station and in the fields is small, lightweight, power-thrifty, and easy to install.
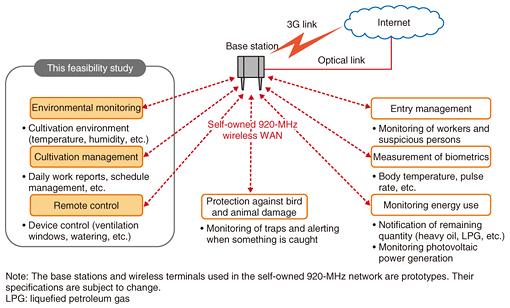
We focused on developing two remote control capabilities for which there was the strongest need: remote control of ventilation and watering in greenhouses, and we placed priority on ensuring ease of operation. 6. Significant benefits derived from data analysis and environmental controlRemote monitoring and simple remote environmental control, both using a self-owned wireless WAN, have raised the efficiency of production management and have also increased crop yields. Data on the temperature, humidity, and amount of water in the fields are obtained in real time and used to control ventilation and watering in plastic greenhouses. Now that data on the production environment and crop growth are available for analysis, numerical management has become possible in the field of agriculture. The feasibility test in Fukushima Prefecture revealed that production management based on the analysis of data on the production environment has improved farm work efficiency, despite the increased travel time caused by the earthquake, and has made it possible to extend the harvest period. As a result, it has become possible to reduce the workforce needed for harvesting and to shift the harvest time from that of other producers in the neighborhood so that harvested products can be sold at higher prices. Furthermore, the annual crop yield has increased by 35%, a clear indication that visualization of data and remote control of the production environment is effective. 7. ConclusionThe agriculture support solution provided by NTT FACILITIES makes it possible to remotely monitor many fields scattered over a wide area. This is useful even for large-scale producers and communities that want to share and accumulate information about their production environments. The solution will provide strong support for fail-free agriculture, that is, efficient and stable farm management, and encourage the entry of new farmers and farm corporations. Sensor network technology that uses self-owned wireless WANs can also be expanded to cover an entire community (Fig. 5). This will make it possible to integrate management of entry into buildings, measurement of biometrics, monitoring of energy, and protection against bird and animal damage into a comprehensive form of smart agriculture. This will lead to enhanced distribution of information vital for farm communities and will contribute to the revitalization of rural communities.
References
|
||||||||||