|
|||||||||||||||||
|
|
|||||||||||||||||
       |
Feature Articles: 2020 Showcase Vol. 14, No. 12, pp. 43–50, Dec. 2016. https://doi.org/10.53829/ntr201612fa7 2020 MICE—New Hospitality through Exhibitions × ICTAbstractNTT Service Evolution Laboratories is now verifying technologies on site in preparation for 2020 Showcase. In line with this verification, the R&D Forum Showcase was exhibited at NTT R&D Forum 2016 held in February 2016 as an example application in the MICE (meetings, incentives, conventions, exhibitions) field. This article introduces research technologies that visitors were able to experience through the exhibits and through the official application of this event. Keywords: showcase, MICE, NTT R&D Forum
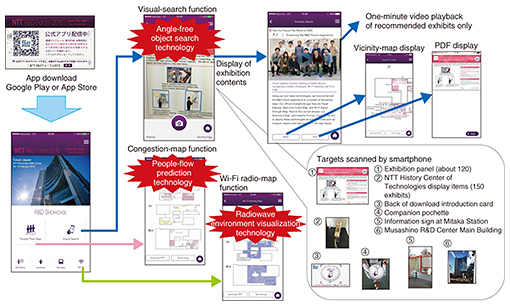
1. IntroductionAt NTT Service Evolution Laboratories, we are striving to create cutting-edge ubiquitous broadband service technologies and promoting research and development (R&D) of service-provision platform configuration technologies. In particular, as we prepare for 2020 Showcase and target visitors to international conferences and events, we are performing verification tests focused on the MICE (meetings, incentives, conventions, exhibitions) [1] field. In this article, we describe R&D Forum Showcase, which was exhibited at NTT R&D Forum 2016, as an example of the above-described efforts. 2. R&D Forum Showcase exhibitionAt NTT Service Evolution Laboratories, we are expanding demonstration systems that we have developed and performing verification tests focused on the MICE field. We aim to not only introduce new business and services based on these technologies and apply them by 2020 at certain events, but also to continuously expand them after the events. To achieve this aim, we are continuing R&D and systemization aimed at providing an epoch-making hospitality user interface/user experience (UI/UX) by using the most advanced technologies [2–4]. Held every year in February, the NTT R&D Forum is an exhibition for introducing cutting-edge technologies developed at NTT laboratories. It is an important event for exhibiting the results of research performed with our business partners. The main elements of the R&D Forum Showcase are described here. (1) NTT R&D Forum 2016 Official App The NTT R&D Forum 2016 Official App (hereafter, official app) was developed as a MICE-support application with the goal of displaying information in a manner that allows visitors to effortlessly tour the NTT R&D Forum as well as experiencing on the app itself the latest technologies developed at the laboratories (Fig. 1). These technologies are explained in detail in section 3.
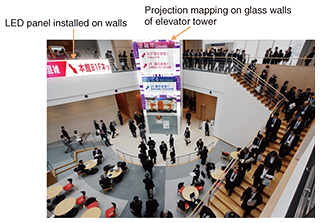
(2) Digital signage Digital signage (Fig. 2) helped visitors to efficiently tour the Forum by displaying guidance information via projection mapping and LED (light emitting diode) panels as well as projecting a congestion map indicating the state of congestion at each exhibit at the Forum (as explained later). In contrast to conventional signboards in which information is fixed and remains static, digital signage can present information in a manner that is instinctively easy to understand by changing the content flexibly according to the state of congestion and by utilizing moving animation.
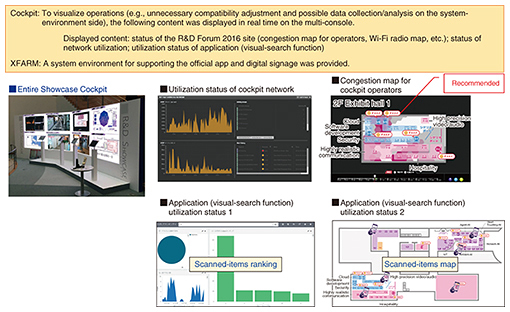
(3) Showcase Cockpit The Showcase Cockpit was configured with the aim of enabling visitors to the Forum to imagine how the event was operating (Fig. 3). This was done by displaying in real time the state of the venue (i.e., degree of congestion) via a congestion map and Wi-Fi radio map at each exhibition (explained in the following sections), and the state of utilization of the network and various applications on a multi-console. In fact, the information presented on the Showcase Cockpit is in essence a real-time monitoring of the utilization state of the official app. For example, when the visual-search function (explained below) was used at the venue, its utilization state was displayed on the map in real time. This made it possible to find out whether a particular booth was drawing attention. XFARM [5]—a cloud platform of NTT laboratories for service creation—was applied under this implementation setting. The use of XFARM makes it possible to smoothly promote activities ranging from service visualization to development and operation trials in the manner we achieved for the R&D Forum Showcase.
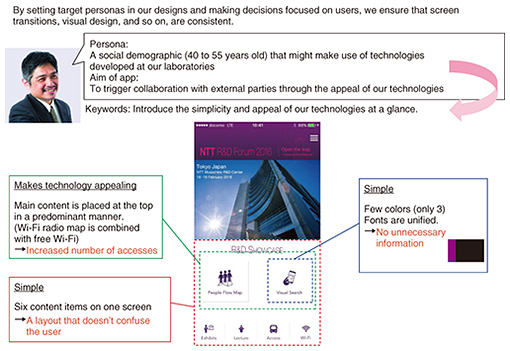
3. NTT R&D Forum 2016 Official AppThe official app was developed as a MICE-support application for Android*1 smartphones and iPhones*2. It was made available via the respective app stores for each type of phone (until August 2016) so that visitors could use it on whichever smartphone they possessed. At NTT R&D Forums held in past years, no MICE-supported application was developed, so the 2016 Forum marks the first time such an app was tried. Of the approximately 10,000 visitors to the Forum (over the four days it was held), about 4600 downloaded the official app, more than 40% of the total number of visitors. The number of downloads was about 20% of the number of visitors with standard MICE-support apps, and the official app was rated highly by those who downloaded it. The official app provides the functions of standard MICE-support apps (namely, displaying the content of each exhibit, lecture schedules, access information, and providing connection to free Wi-Fi services) and also provides the following functions to showcase technologies developed at the laboratories: (1) Visual-search function (2) Congestion-map function (3) Wi-Fi radio-map function Moreover, to improve the UX of each visitor, we applied human-centered service design [6] at the design stage of the UI of the official app (including the functions listed above). An example of this human-centered service design is shown in Fig. 4. In concrete terms, we studied visitor-application scenarios of the official app, determined the social demographic of the target users, and designed the app on the basis of the persona (i.e., virtual character) of that social demographic. In developing the app, we set the persona as a character (namely, a person 40 to 55 years of age in a management position) who has the power to influence decisions on business collaborations with outside organizations, and on the basis of that persona, we put the required specifications for creating the official app into writing. We focused on three key points regarding screen transitions and visual design—namely, making the technology appealing, maintaining simplicity, and introducing the simplicity and appeal of our technologies at a glance—and we integrated these points into the design of the official app’s UI.
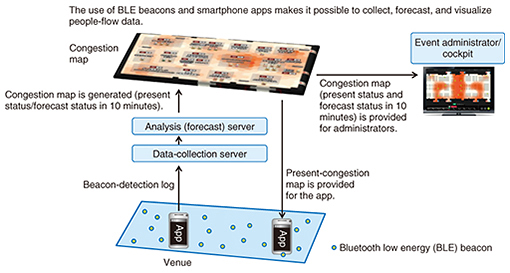
For example, displayed content was narrowed down to six items and placed on the top screen of the official app to maintain simplicity, and a function to appeal to the user via a showcase was located boldly in the upper part of the screen as the main content. The content (including the function to appeal to the user) was displayed in purple to give the whole UI a calm look. Furthermore, the official app was configured so that technology introduction pages could be individually introduced in a simple manner and technological points could be understood easily while the app was operated. 3.1 Visual-search functionThe visual-search function applies angle-free object search technology developed by NTT Media Intelligence Laboratories. When the visitor photographs an exhibit panel, the function displays detailed information concerning the photographed object. This technology can distinguish unwanted things included in the target object even if the image is captured from various angles, and it makes it possible to determine the content of an exhibit even from a distance by photographing the exhibit panel with a smartphone camera. In this way, even if the writing on a panel at a booth cannot be deciphered, it is possible for visitors to confirm the details about the booth and decide whether to walk around a little and come back to the exhibit at another time if the exhibit is congested. The objects photographed using the visual-search function are shown at the bottom right of Fig. 1. When about 150 exhibited objects from the NTT History Center of Technologies (set up at the exhibition venue) and about 120 display panels were photographed, detailed information about the exhibited objects was presented to the user. Then, when visual-search marks (displayed on introduction cards distributed outside the exhibition venue, posters inside the venue, companion pochettes (small bags), etc.) are photographed, special content is presented to the user. Moreover, when information boards at Mitaka Station are photographed with the app-loaded smartphone, bus timetables to the exhibition venue are displayed on the smartphone, and when the NTT Musashino Main Building is photographed, original content is provided. This enabled visitors to experience a visual-search function in correspondence with various physical objects. Furthermore, when we analyzed the recognition results concerning the images taken by the visitors, it became clear that the captured objects were accurately recognized even when the target was far away or at a difficult-to-capture angle. In other words, we confirmed that the app-service can be utilized even when the target objects and their environment are constrained. In combination with an advanced transparent display device (developed by Panasonic Corporation) [7], the visual-search function successfully demonstrated a futuristic kind of information navigation. Using such a transparent display device makes it possible to display information superimposed onto the target object, for example, with a sentence informing the user that the tall nearby structure is Tokyo Tower. This manner of providing information can be targeted at foreign visitors to Japan (whose number is forecast to increase over the next few years), and detailed information navigation can be provided in accordance with the attributes and movements of each and every visitor. 3.2 Congestion-map functionThe congestion-map function utilizes people-flow forecasting and induction technology developed by NTT Service Evolution Laboratories to tell visitors which areas of the exhibition venue are crowded or not. An overview of the congestion-map function is shown in Fig. 5.
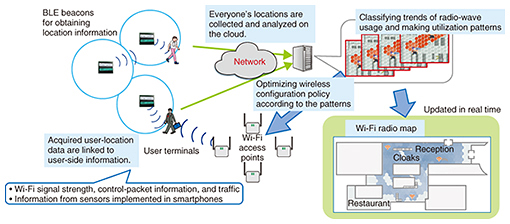
The congestion-map function consisted of Bluetooth*3 low energy (BLE) beacons installed at more than 150 locations around the exhibition venue. When visitors carrying an official-app-installed smartphone entered the venue, the identification of the BLE beacon with the highest received power was transmitted to the cloud. On the cloud, the numbers of such beacons were counted, and a congestion map (indicating present congestion and forecasted congestion in 10 minutes) was formulated in the form of a heat map. A characteristic feature of this people-flow forecasting technology is that even if measurement data are not accumulated from this physical environment over a long period of time, it is possible to forecast congestion in 10 minutes from the most recent data (i.e., data collected in the preceding 30 minutes). Accordingly, an advantage of this technology is that it can also be used at temporary sites in addition to permanent ones such as that of the R&D Forum. Although the official app currently only displays the congestion map, the visualized and forecasted (10 minutes in the future) people flow (calculated from data collected in the past 30 minutes) can be displayed on digital signage (as shown in Fig. 2). In this way, presenting the degree of congestion in each exhibition area to the visitors makes it possible for them to experience people-flow forecasting and induction technology for themselves. 3.3 Wi-Fi radio-map functionThe Wi-Fi radio-map function utilizes radiowave-environment visualization technology developed by NTT Access Network Service Systems Laboratories to display the signal strength of free Wi-Fi access points. An overview of the radiowave-environment visualization technology and the Wi-Fi radio-map function is shown in Fig. 6.
Information related to radio waves is gathered using an approach called collective intelligence. Namely, Wi-Fi signal strength is measured and collected using the terminals of all visitors on which the application is installed. Thereby, the current radio map can be formed without dedicated measuring instruments. When the signal strength is gathered, the data are combined with the position information obtained by the location function from the BLE beacons (which are also used by the congestion-map function described above). When the Forum was held, free Wi-Fi areas were set up around the venue so that official-app-installed smartphones could access free Wi-Fi. Accordingly, by indicating areas with easy connection to free Wi-Fi to visitors, we enabled visitors to experience the radiowave-environment visualization technology for themselves. 4. Future developmentThis article introduced the R&D Forum Showcase—which was exhibited at the NTT R&D Forum—as an example of verification tests in the MICE field. In particular, three functions provided by the NTT R&D Forum 2016 Official App—namely, a visual-search function, congestion-map function, and Wi-Fi radio-map function—were described as showcase technologies developed at NTT laboratories. At NTT Service Evolution Laboratories, we will continue working to improve these technologies in time for the year 2020 through collaborations with partners in different industries. Moreover, we will continue to promote R&D aimed at applying these technologies in MICE fields such as exhibitions, museums, art galleries, airports, and train stations. References
|
||||||||||||||||