|
|||||||||||||||||
|
|
|||||||||||||||||
       |
Regular Articles Vol. 17, No. 8, pp. 11–15, Aug. 2019. https://doi.org/10.53829/ntr201908ra1 Electron Spin Resonance Spectroscopy Using a Superconducting Flux QubitAbstractWe use a superconducting flux qubit for the sensing application of electron spin resonance (ESR) spectroscopy. The superconducting flux qubit is a highly sensitive magnetometer with micrometer-scale spatial resolution. The sensitivity of our spectrometer is 400 spins/√Hz, and the sensing volume is 0.05 pL. This high sensitivity and high spatial resolution enable us to investigate a small number of electron spins in a microscale area. The spectrometer also obtains a wider ESR spectrum range with two-parameter (frequency and magnetic field) scanning. This enables us to refine the material parameters. Keywords: superconducting flux qubit, electron spin resonance, sensing
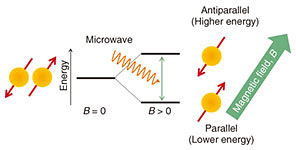
1. Electron spin resonanceThe spin resonance phenomenon occurs in various actions undertaken in ordinary life, for example, when visualizing the properties of a human body using magnetic resonance imaging (MRI). The target of MRI is nuclear spins in atoms (nuclear magnetic resonance: NMR), but electron spins are also good targets for the spin resonance technique. Historically, the proof-of-principle experiment of electron spin resonance (ESR) occurred earlier than NMR. ESR is a commonly used tool to investigate the electron properties in materials. An electron spin can be considered as a small magnet. When an external magnetic field is applied, the electron spin has different energy depending on its orientation to the external magnetic field. The parallel spin is more stable (lower energy) than the antiparallel one (Fig. 1). To detect this energy splitting as an X-band microwave response, a magnetic field of around 300 mT is usually applied to the spin. The energy splitting can then be investigated by measuring the microwave transmittance because if the spins resonate with the microwave, the spin resonance will appear as microwave absorption. This microwave response of the spin contains information on the target material, and the spectrum is considered to be a fingerprint of the material, which can be used to identify the material.
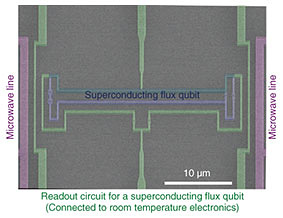
In standard ESR spectrometers, microwave cavities (metal boxes) are utilized as a sensor to detect the electron spins. The target sample is enclosed in the cavity, and the microwave transmittance of the cavity is measured as a function of an external magnetic field. However, we use a magnetometer to sense the state of the spins because if the spins resonate with the microwave, the spin resonance can also be detected as a change in the magnetic field generated by the spins. In this work, we have developed an ESR spectrometer with a superconducting flux qubit that works as a magnetometer with a micrometer-scale spatial resolution. 2. ESR spectrometer with a superconducting flux qubitWe investigated a magnetometer based ESR spectrometer using a superconducting quantum interference device (SQUID) [1, 2]. The sensitivity was improved from 106 spins/√Hz to 15,000 spins/√Hz by improving the magnetic sensitivity of the SQUID magnetometers using a faster readout method of the SQUID. Here, we use a superconducting flux qubit as a sensitive magnetometer to sense the magnetic field generated by electron spins to further improve the sensitivity [3]. A scanning electron microscope image of the device is shown in Fig. 2. The superconducting flux qubit (blue false-colored area) senses a magnetic field through the loop structure.
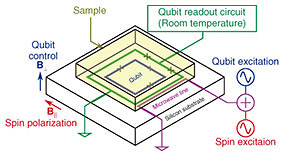
The experimental setup of our ESR spectrometer is shown in Fig. 3. We prepare the superconducting flux qubit on a silicon substrate. The target sample is directly attached on top of the substrate. Magnetic fields are applied in two directions. An out-of-plane magnetic field is applied to control the flux qubit, while an in-plane magnetic field is applied to polarize the spins in the target sample. A microwave line near the flux qubit is used for two purposes: for the spectroscopy of the flux qubit and for exciting the spins in the sample. In the experiment, only one line of the purple false-colored area in Fig. 2 is used. The state of the flux qubit is read by the readout circuit fabricated on the same chip (green false-colored area in Fig. 2) which is connected to room temperature electronics. The experiment is performed below 20 mK using a dry dilution refrigerator.
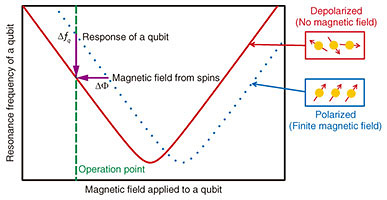
The principle to detect a magnetic field using a superconducting flux qubit is depicted in Fig. 4. The flux qubit is the artificial atom whose energy structure (Fig. 4) is controllable by an external magnetic field. If an external magnetic field is applied to the flux qubit, the energy level curve shifts from the blue one to the red one. This change in the magnetic field can be converted to the change in the qubit resonance frequency by fixing the operation point of the qubit at a specific point (green dashed line). Thus, we can measure the magnetic field shift by monitoring the qubit resonance frequency. In our experiment, the detected magnetic field shift is caused by the change in the electron spin alignment, namely, the polarization ratio (Fig. 4).
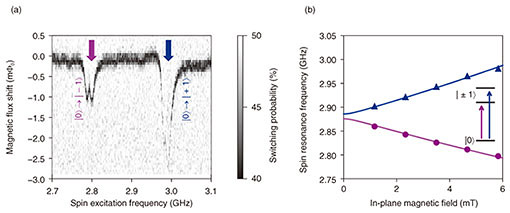
To excite the spin ensemble, we use a microwave line near the flux qubit. When a microwave signal is applied to the line, electron spin near the line is excited, and this changes the magnetic field when the energy splitting of the spin resonates with the microwave energy. We detect this change in the magnetic field generated by the spin system using the flux qubit. In the experiment, we sweep the microwave frequency of the spin excitation to obtain the ESR spectrum of the target material. 3. ESR spectroscopy of nitrogen-vacancy centersWe use nitrogen-vacancy (NV) centers in diamond [4] as a target sample of ESR spectroscopy. A measured ESR spectrum under the fixed in-plane magnetic field of 5.8 mT is shown in Fig. 5(a). The two sharp dips at around 2.8 GHz and 3.0 GHz appear to reflect the electron spin properties of the NV centers because NV centers have a three-level structure (Fig. 5(b) inset). After repeating this measurement for various magnetic fields, we plot the peak position of the spectrum as a function of the in-plane magnetic field (Fig. 5(b)). The positions of the peaks split into two branches starting from the position of the zero field splitting of 2.88 GHz. The material parameters of the NV center can be extracted by fitting the experimental data. The resulting g-factor and zero field splitting were respectively determined to be 1.996 ± 0.013 and 2.88071 ± 0.00087 GHz. These results agree well with the values from the literature [4] within the range of the error bars. It is worth mentioning that our spectrometer can sweep two parameters—magnetic field and spin excitation frequency—while standard ESR spectrometers can only sweep the magnetic field. This wider range of parameter sweep enables us to refine the material parameters. It is especially powerful in investigating low frequency spin transitions where the features of hyperfine and quadrupole interactions appear.
4. Sensitivity and sensing volumeWe estimate figures of merit of our ESR spectrometer: sensitivity and sensing volume. The sensing volume is calculated by multiplying the sensing area and the effective sensing height. The sensing area of our magnetometer is limited to the loop structure of 47.2 μm2, and only the spins within a height of ~1 μm can be detected [5]. Thus, the sensing volume is calculated to be ~0.05 pL. The sensitivity is estimated by analyzing the noise of the magnetometer signal output. By measuring the noise for an integration time of one second and converting the noise to the number of spins using experimentally determined parameters, we estimate the sensitivity to 400 spins/√Hz. This value is comparable to state-of-the-art ESR spectrometers using superconducting technologies [6, 7]. 5. Future workWe plan to improve the sensitivity and the spatial resolution of the spectrometer by refining the design of the superconducting flux qubit and the measurement system. We will also fabricate a flux qubit array to obtain spatial distribution of the materials. In this article, we have only focused on solid-state spins. However, the application area of our ESR spectrometer is not limited to such spins, and we are planning to measure soft materials such as bio-related materials. References
|
||||||||||||||||