|
|||||||||||||||||
|
|
|||||||||||||||||
       |
Feature Articles: ICT Platform for Connected Vehicles Created by NTT and Toyota Vol. 20, No. 7, pp. 76–82, July 2022. https://doi.org/10.53829/ntr202207fa11 Lane-specific Traffic-jam-detection TechnologyAbstractDynamic maps are being constructed to support automated driving and advanced navigation. They combine high-precision map information with traffic-related information, such as that about traffic controls and jams. We at NTT believe that detecting lane-specific traffic jams, such as those caused by a queue of vehicles waiting to enter the parking lot of a commercial facility or by vehicles parked on the street, and providing information on these jams will enable unprecedentedly advanced navigation. This article describes a technology for detecting lane-specific traffic jams on the basis of information that can be collected from connected vehicles. Keywords: lane-specific traffic jam, connected vehicle, traffic flow optimization
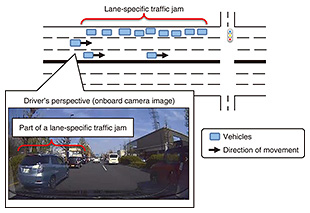
1. IntroductionDynamic maps [1] are being constructed to support automated driving and advanced navigation. They combine high-precision map information with traffic-related information such as that about traffic controls and jams. Such traffic-related information is mapped on a dynamic map in real time, enabling map systems to detect road-traffic conditions and provide services, such as navigation, to optimize traffic flow. To construct a dynamic map, an approach is needed to collect, in real time, traffic-related information on roads across the country. Examples of such an approach are millimeter-wave radar [2] and traffic counters [3], which can be used to measure the volume of the flow of passing vehicles at fixed points, thus detect traffic jams. However, they must be installed at all locations where traffic jams are expected, so cannot cover a wide area. Another approach [4] involves using the smartphones of drivers to measure their vehicle speeds to detect traffic jams. This approach can cover a wide area but does not provide lane-specific resolution. In real-world traffic, lane-specific queues occur at various locations such as at the entrance to the parking lot of a commercial facility, at the exits of highways, or in turn lanes at intersections. When drivers who are new to an area encounter such a queue, they find it difficult to judge whether they need to stay in the queue to reach their destination. They may wait in a queue unnecessarily or avoid the queue when they actually need to join it, with the result that they must take a roundabout route to reach their destinations. If lane-specific queues (traffic jams) and specific sections within a queue can be detected, it will be possible to provide unprecedented, advanced driving assistance, such as lane-specific navigation, that determines, on the basis of the driver’s destination, whether the driver should join or avoid a queue in a particular lane, enabling drivers to reach their destinations without queuing up unnecessarily. This article describes a technology that detects lane-specific traffic jams on the basis of video data and vehicle speeds obtained from connected vehicles [5]. 2. Lane-specific traffic-jam-detection technology2.1 DefinitionTaking a cue from the definition of a traffic jam applied to current services on general roads [6], we defined a lane-specific traffic jam as a line of traffic moving at 10 km/h or less. We also defined the minimum length of a traffic jam as 42 m, which is 1/10 the length defined in current services. In this article, the connected vehicle from which data are collected is referred to as an observation vehicle, and vehicles other than the observation vehicle that appear in images from the onboard camera mounted on the observation vehicle are referred to as other vehicles. 2.2 Processing overviewFigure 1 illustrates road conditions and an onboard camera image when a lane-specific traffic jam is encountered. From the onboard camera video taken with the observation vehicle, our technology counts other vehicles overtaken by the observation vehicle and that of other vehicles that passed in the opposite lane. The density of other vehicles can then be calculated from the speed of the observation vehicle and number of vehicles counted in each lane. A lane-specific traffic jam can be detected from this density calculation. When a lane-specific traffic jam is detected, the timeframe used to evaluate the traffic jam is shifted, and the evaluation is repeated to estimate the section where the lane-specific traffic jam is located and identify the vehicles at the front and back of the queue.
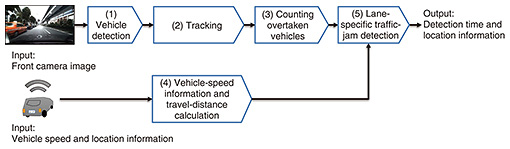
2.3 Processing flowThe front camera of the observation vehicle takes a video of the direction in which the vehicle is moving. From that video, the following processes are executed, as shown in Fig. 2.
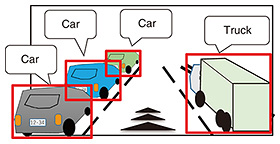
(1) Detecting vehicles The collected video is divided into frames, and an object-detection technology [7] is used to detect other vehicles in each frame. A detected vehicle is represented as a rectangle (detection rectangle) and labeled as a car, truck, or bus on the basis of the vehicle type (Fig. 3).
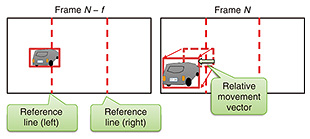
(2) Tracking Since the relative positions between the observation vehicle and other vehicles change over time, the movements of other vehicles between frames are tracked and numbered. Next, a number is assigned to each of the other vehicles in each frame. The degree of similarity between the detected rectangle X in the current frame N and detected rectangle Y in the f-th frame back from N (i.e., Frame N – f) is evaluated using a similarity measure between two sets. This measure is called the intersection over union (IoU): A pair of rectangles with the largest IoU, i.e., the rectangles with the most common pixels, are judged to be the same vehicle. This makes it possible to track the trajectory of this vehicle. (3) Counting overtaken vehicles The same reference lines are drawn on each frame (Fig. 4). The trajectory of the other vehicle obtained by tracking is expressed as a relative movement vector. When the relative movement vector (of one of the other vehicles) from the road-perspective vanishing point to the outside of the frame intersects a reference line, it is determined that the observation vehicle has overtaken this other vehicle. In this manner, overtaken vehicles are counted.
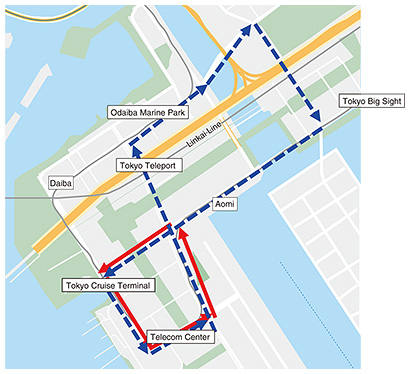
(4) Calculating the travel distance The distance traveled by the observation vehicle is calculated from the vehicle-speed information. (5) Detecting a lane-specific traffic jam Unfortunately, the threshold for the number of overtaken vehicles per evaluation timeframe is not clear. Therefore, we instead used the density of the overtaken vehicles (vehicle density) as a temporary solution because it is reasonable to think that the distance between vehicles is shorter in a traffic jam than in normally flowing traffic. The threshold for the distance occupied by the vehicles in the adjacent lane (called the occupied distance threshold, Lθ) due to a traffic jam is calculated from the number of overtaken vehicles, the length, li, of an overtaken vehicle i, and the distance, Although vehicle length varies from vehicle to vehicle, we used the following vehicle lengths in our learning model for simplicity. The length of a car lcar = 4.8 m, that of a truck ltruck = 12.0 m, and that of a bus lbus = 12.0 m. The distance between two vehicles, 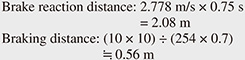 Let x, y, and z respectively denote the number of cars, number of trucks, and number of buses that were overtaken. Then, the occupied length is If this occupied distance is longer than the observation vehicle’s travel distance D, i.e., if the distance between vehicles is shorter than the defined threshold, it is determined to be a lane-specific traffic jam. 2.4 Other new featuresTo improve detection accuracy, it is important to prevent object-detection failures caused by backlighting or reflections. For this purpose, a Kalman filter is used to predict where the other vehicles are heading. To determine whether other vehicles are running in the same direction as the observation vehicle or running in the opposite lane, our technology examines whether the video shows the front or back of a vehicle. If there are many vehicles facing towards the camera, the system determines that the other vehicles are in the opposite lane and reverses the front and last vehicles. 3. Field trials3.1 Overview of the evaluationThe accuracy of our lane-specific traffic-jam-detection technology was evaluated using a test vehicle—running in the Odaiba district, Minato Ward, Tokyo—as the observation vehicle. The vehicle ran on the two routes indicated with the solid red line and dotted blue line in Fig. 5. Preliminary investigations indicated that there is a high probability of naturally occurring lane-specific traffic jams on these routes. A camera was installed in the upper front of the observation vehicle. The resolution of the video from this camera was 1920 × 1080 pixels. The video was taken at 10 fps and saved. The location information expressed in latitude and longitude was obtained at one-second intervals using GPS (Global Positioning System). The vehicle’s speed was determined on the basis of the change in the vehicle’s location over time.
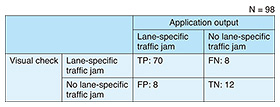
3.2 Evaluation of accuracy in detecting lane-specific traffic jamsThis section describes the accuracy evaluation conducted using 48 videos (each 60 s long) for situations in which the presence of a lane-specific traffic jam was visually confirmed. (1) Visual check We decided that our technology must be able to detect any lane-specific traffic jam with a length of 42 m or longer. We manually extracted video scenes in which the observation vehicle continuously overtook a series of vehicles, such as three cars and one truck. The data in these visually verified scenes were treated as the correct data. (2) Accuracy evaluation Table 1 shows a confusion matrix comparing the results of the visual check and the application output. Precision (true positive (TP)/(TP+ false positive (FP))) was 89.7%. The main factor for an FP was the effect of vehicles in parking lots or other premises. This applied to three cases. The main factor for a false negative (FN) was object-detection errors caused when some vehicles in the opposite lane were hidden behind guardrails or other objects, even though a lane-specific traffic jam was present in that lane. This applied to four cases. Factors common to both FP and FN included object-detection errors, errors caused because we fixed the occupied distance of other vehicles, and inaccurate travel distance of the observation vehicle due to errors in positional information.
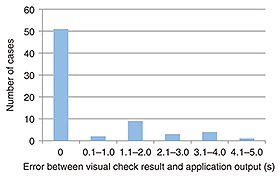
3.3 Evaluation of accuracy in estimating the front vehicle in a queueWe conducted an additional evaluation for 70 TP scenes, scenes for which both the visual check and application output indicated the presence of a lane-specific traffic jam. We compared the frame in which the visual check determined that the observation vehicle overtook the front vehicle with the frame in which the application did the same. The comparison results are shown in Fig. 6. The average difference in time between the two frames was 0.57 s, the median was 0 s, and the maximum was 4.1 s. The speed limit on these routes is 50 km/h. With the distance between cars taken into account, the time required to overtake a car is approximately 0.7 s. Therefore, the average difference of 0.57 s is acceptable. We examined 14 cases in which the error was 1.6 s or more and identified two main factors that caused the large error. The first was that there were errors in the positional information and, as a result, the observation vehicle’s travel distance was not calculated accurately (the distance calculation process was either continued or interrupted). This applied to nine cases. The second factor was that cars were incorrectly recognized as trucks or vice versa. This applied to three cases.
4. ConclusionWe developed a lane-specific traffic-jam-detection technology. It uses video data, vehicle speed, and location information that can be collected from a single connected vehicle to determine if there is a traffic jam in each lane and, if there is, identify the front and the last vehicles in the traffic queue. We conducted field trials, in which the accuracy of traffic-jam detection and the estimation of the vehicle at the front of a queue were evaluated on the basis of the video from a front-facing onboard camera and positional information. We plan to improve the accuracy of our technology and study methods for identifying the causes of lane-specific traffic jams. References
|
||||||||||||||||