|
|||||||||||
|
|
|||||||||||
       |
Feature Articles: ICT Platform for Connected Vehicles Created by NTT and Toyota Vol. 20, No. 7, pp. 61–67, July 2022. https://doi.org/10.53829/ntr202207fa9 Selective Vehicle-data-collection AlgorithmAbstractIn an obstacle-detection use case, in which a monitoring system keeps track of an obstacle on the road, the system needs to continuously collect the latest images of the obstacle captured using onboard cameras. Although image-recognition technology can be used to accurately select relevant images (images that capture the obstacle in question), computational resources available in a vehicle are too limited to execute this task. In addition, transferring all images via a mobile network to the cloud incurs considerable communication costs. To solve these problems, we devised a technology that estimates the range of the area that can be captured with each camera (hereafter, visible range) and selectively collects only the relevant images. The visible range is estimated on the basis of meta-information, such as vehicle position, direction of movement, and camera angle of view. Keywords: connected vehicle, data collection, priority control
1. Potential of connected vehiclesConnected vehicles are expected to become key players in using information and communication technology in road transportation. They also hold great potential as a sensing platform. Since connected vehicles are equipped with various high-end sensors and communication modules and move around a city with virtually no risk of running out of battery, they are ideal as mobile sensor nodes. If camera images and LiDAR (light detection and ranging)* point-cloud data from tens of millions of connected vehicles could be collected, it would be possible to continuously scan an entire city and build a digital twin of that city.
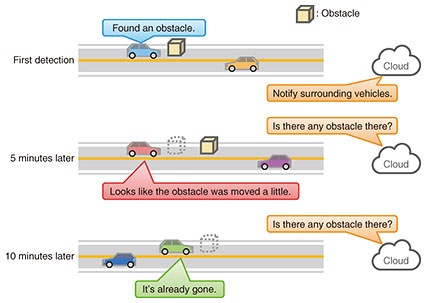
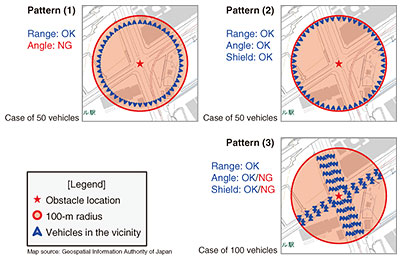
2. Assumed use caseUnfortunately, the total amount of sensor data generated by tens of millions of connected vehicles ranges from 10 to 100 Tbit/s. This is too enormous for communication networks, computers, and storage units to handle. This means that it is impractical to collect all available sensor data. It should be noted that sensor data include not only data that should be collected immediately but also data for which some collection delay is tolerable, data for which periodic collection is sufficient, and data that are of no value. Therefore, it is important to selectively collect important sensor data on a priority basis. By adjusting the pace and timing of sensor-data collection in accordance with the amount of load on the communication network and computers, it is also possible to equalize the load fluctuation over time, thus improve facility-utilization efficiency. The collaboration projects between Toyota Motor Corporation and the NTT Group include several use cases that require the selective collection of sensor data. This article focuses on the obstacle-detection use case and introduces the technical challenges, implementation details, and our efforts to improve the performance of selective collection. In this use case, obstacles on the road are assumed to be moved by the wind or removed by the road administrator. Therefore, the monitoring system keeps track of an obstacle on the road by collecting images from vehicles passing in the vicinity of the obstacle (Fig. 1).
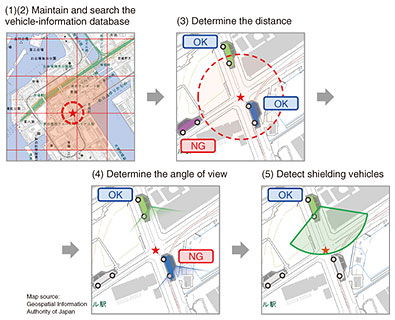
3. Approach based on image recognitionAt first glance, the use of image recognition seems to be the obvious approach to select images that capture the obstacle to be monitored. This approach can be implemented in two different configurations, but both present significant problems. Configuration 1: Image recognition is executed within connected vehicles The simplest configuration is to mount a computer on a connected vehicle to execute image recognition. However, this configuration has three problems unique to vehicles. First, the temperature inside a vehicle under the burning sun in mid-summer can reach close to 80°C [1]. At such a high temperature, it is not easy to keep the computer operating stably. Second, it is said that the average usage rate of passenger cars is only 5%. If the computer stays idle most of the time, having a computer in a passenger car is not cost-effective. Third, the product life cycles of vehicles and computers differ greatly. The computer will reach the end of its life cycle or become obsolete in terms of performance much earlier than the vehicle on which it is mounted. Considering these problems, it is not realistic to install a computer capable of image recognition in a connected vehicle. Configuration 2: Image recognition is executed in the datacenter If there is a connected-vehicle platform in place, all images can be transferred to the datacenter so that image recognition can be executed there. Although this configuration prevents the three problems mentioned above, the cost of image transfer over the mobile network is very high. The load on the mobile network is also enormous because images are sent from tens of millions of vehicles simultaneously. Even if sensor-data traffic from a connected vehicle is just 1 Mbit/s, the total traffic from 10 million vehicles can reach 10 Tbit/s. This is 15 times the current volume of mobile communication traffic in Japan [2]. 4. Approach based on location informationFaced with the problems mentioned above, we re-examined the requirements for the obstacle-detection use case. There is no need to detect an obstacle with high precision during image selection because the collected images are analyzed in detail at a later stage of processing. The number of images to be analyzed should be kept as small as possible because the processing for image analysis requires a large amount of computation. Since the location of the obstacle to be monitored is already known, there is also no reason not to use this information as a clue. In light of the above, we devised a technology that selectively collects images without relying on image recognition. Specifically, it estimates the visible range of the onboard camera of each vehicle on the basis of meta-information, such as the locations of surrounding vehicles, direction of the vehicle’s movement, the vehicle’s size, the angle of view of its camera, and the camera’s resolution. Images that are likely to have captured the obstacle are then selected on the basis of the positional relationship between the obstacle and each vehicle. This image-selection process consists of the following five steps (Fig. 2).
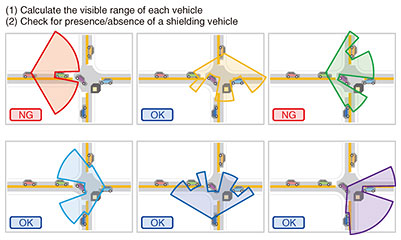
Process 1: Maintain a vehicle-information database Vehicle meta-information, which provides important clues for image selection, is routinely collected from connected vehicles and stored in the real-time spatiotemporal database Axispot™. Process 2: Search the vehicle-information database When a request for obstacle monitoring arrives, the system searches the vehicle-information database using the spatiotemporal index associated with the obstacle location and the current time and selects the search hits as candidate vehicles. Process 3: Determine the distance Next, the distance between each candidate vehicle and the obstacle is calculated, and any vehicle with a distance from the obstacle greater than the visible range of its onboard camera, which is calculated from the resolution of the onboard camera, is eliminated from the list of candidates. Process 4: Determine the angle of view Next, the direction of the obstacle from each candidate vehicle is calculated, and any vehicle that is estimated not to have captured the obstacle within the angle of view of its onboard camera is eliminated from the list of candidates. Process 5: Detect shielding vehicles Finally, the positional relationship between surrounding vehicles and the obstacle on the road is examined, and any vehicle that is found to be unable to detect the obstacle because its view of the obstacle is blocked (shielded) by other vehicles is eliminated from the list of candidates. 5. Reducing complexity for shielding vehicle detectionOf these five steps, the detection of shielding vehicles demands the most complex computation and accounts for the bulk of the computation time. Therefore, during the field trial period, we attempted to substantially improve the algorithm for shielding vehicle detection. This section presents the algorithm before and after this improvement, in this order. The most intuitive method of detecting a shielding vehicle is to calculate the visible range of each candidate vehicle and determine whether there is any vehicle within this range that blocks the view of the obstacle. For example, suppose there are six vehicles in the vicinity of an obstacle, as shown in Fig. 3. A fan-shaped field of view is drawn for each of the six vehicles on the basis of the angle of view and visible range of its camera. The system then checks whether a vehicle’s view of the obstacle is blocked (shielded) by any of the other five vehicles and eliminates any vehicle that is unable to detect the obstacle. Since this method requires a brute-force examination of any shielding vehicle, the computational complexity is O(n2), where n is the number of vehicles. This means that, as the number of vehicles in the vicinity of the obstacle increases, the processing time increases rapidly. Therefore, in situations where many vehicles are densely packed around the obstacle due to traffic congestion, the processing time can become very long.
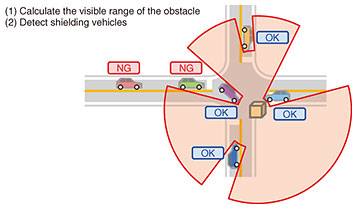
We, therefore, took on the challenge of improving the algorithm to reduce the amount of computation. The key point of this improvement effort was to abandon the conventional approach of calculating the visible range of each onboard camera. We reversed the thinking: from examining whether a vehicle can detect the obstacle to examining whether the obstacle can detect the vehicle (i.e., whether the view of the vehicle from the obstacle is blocked by another vehicle). The system calculates the visible range of the obstacle instead of the visible range of the vehicle to determine whether any vehicle blocks the view of the obstacle from each vehicle (Fig. 4). With this method, the system examines each vehicle, one by one, to check whether it blocks the view of other vehicles. This eliminates the need for a brute-force calculation and reduces the computational complexity to O(n). Also, by approximating the fields of view as a set of fan shapes, the process of determining whether a vehicle blocks the view of others can be implemented in a very simple manner.
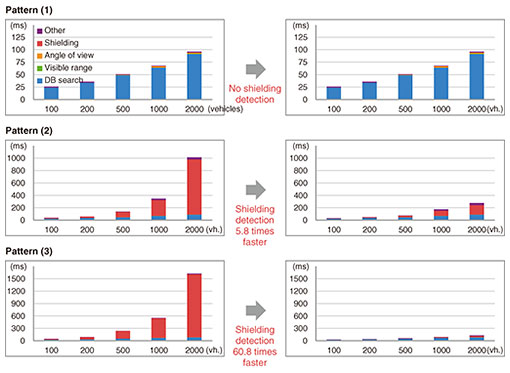
6. Performance evaluationWe evaluated the processing time before and after the algorithm improvement for various vehicle location patterns (Fig. 5). It was assumed that the visible range of the onboard cameras was 100 m. The number of vehicles posited to be present within a 100-m radius of the obstacle was varied. To evaluate the worst case, it was important to set a sufficiently high upper limit for the number of vehicles. We set the upper limit at 2000 vehicles, assuming that the vehicles were packed as densely as in a parking lot. Java was used as the language for implementing the selection algorithm. A geometric calculation library called JTS Topology Suite [3] was used with the algorithm before the improvement, but not after the improvement.
Figure 6 shows the processing time for each vehicle-location pattern with varying the number of vehicles. Before the algorithm improvement, the processing time for detecting shielding vehicles increased rapidly in proportion to the square of the number of vehicles. After the algorithm improvement, the processing time was proportional to the number of vehicles. In the worst-case scenario with 2000 vehicles, the processing time for detecting shielding vehicles was 25 ms, which is 1/60 of the processing time before the algorithm improvement.
7. Future outlookIn these field trials, we optimized the shielding-vehicle-detection algorithm for the requirements of the obstacle-detection use case and achieved a processing speed 60 times faster than that for when the algorithm was implemented in a conventional manner using a geometric calculation library. In the future, we will investigate the possibility of using our study results for applications other than connected vehicles. For example, when creating a digital twin of a city, it is necessary to ensure that it reflects the latest state of the city by periodically re-sensing every area. Some parts of the cityscape change more frequently than others. Therefore, it is more efficient to systematically re-sense only key areas frequently than to uniformly re-sense the entire city. In such situations, the algorithm presented in this article could be used to efficiently select data to be collected. We will also study application-related issues, such as issues that may arise when the monitoring targets are widely spread or when position information contains errors. References
|
||||||||||