|
|||||||||||||||
|
|
|||||||||||||||
       |
Feature Articles: Front-line Research on Graphene Vol. 11, No. 8, pp. 10–14, Aug. 2013. https://doi.org/10.53829/ntr201308fa2 Basic Principles of Raman Spectroscopy for GrapheneAbstractGraphene is a planar honeycomb network composed of carbon atoms. Even though graphene has a very simple structure, it has received considerable attention from researchers in various fields. This article explains the basic principles of Raman spectroscopy for use with graphene in order to provide insight into the unique properties of graphene.
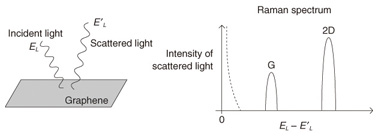
1. Overview of Raman spectroscopyWhen laser light is applied to a sample, it is scattered with a finite probability. If we plot the intensity of scattered light as a function of its energy, we may find that several peaks (or bands) appear in the result, as shown in Fig. 1. The spectrum of scattered light as a function of the energy shift is known as the Raman spectrum, which is the main data obtained from Raman spectroscopy. Normally, the intensity is at a maximum when the energy of scattered light is equal to that of incident light. However, this is not the only peak. There are other peaks for which the energy shift is nonzero. Since the energy is conserved, the energy difference corresponds to the energy that is absorbed into the sample. When the peak originates from the interaction between light and a lattice vibration (called a phonon), the energy shift corresponds to the energy of a Raman active phonon.
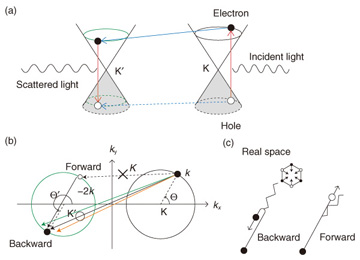
If we know that the energy of a Raman active phonon in sample A is 500 cm−1 and that in sample B is 530 cm−1, we can identify the sample by using Raman spectroscopy. This describes the basic use of Raman spectroscopy as a characterization tool. We know that for graphene there are two principal Raman bands: one peak appears at ~1580 cm−1, which is called the G band, and the other peak is seen at ~2700 cm−1, which is called the 2D band (or G’ band). If a sample does not show a G or 2D band, we do not consider it to be graphene. Raman spectroscopy is useful not only for characterizing a sample, but also for obtaining information about a sample. This is partly because there are several parameters that we can change in Raman spectroscopy measurements. For example, the energy of incident laser light (EL) can be changed. For graphene, the G band energy is known to be insensitive to the change in EL, whereas the 2D band energy increases linearly as EL increases. What is the physics behind the dispersive (nondispersive) behavior of the 2D (G) band? This is the central issue that we would like to explore in this review article. 2. Phonon wave vectorPhonons in graphene form the energy band structures, and a phonon’s energy is a function of the wave vector q as ħω(q). If we assume that a phonon’s energy does not depend on the EL value used in the experiment (which is true for most experimental conditions), the nondispersive behavior of the G band suggests that the identical phonon with a fixed q value is created while EL is changed. In fact, the wave vector of the G phonon is q = 0 (the Γ point), and the nondispersive behavior of the G band is reasonably understood because ħω(0) is independent of EL. Meanwhile, many studies have revealed that the 2D band consists of two A1g zone-boundary phonons. The wave vector of each phonon is near the K point; namely, it is written as K + q, where q represents a small derivation from K (the wave vector of the K point). A reasonable solution to explain the dispersive behavior of the 2D band is to think that the wave vector q is changed by changing EL. Let us explain the reason for the EL dependence of q. A process for the 2D band that is induced in the electronic band structures called Dirac cones by laser light is shown in Fig. 2(a). Because the wave vector of light (typically ~1/600 nm) is much smaller than the wave vector of electrons and holes, optical transitions are possible only when an electron is transferred between the valence and conduction bands without a change in its wave vector. Thus, a vertical electron-hole pair is created by light, and it is annihilated by the emission of scattered light. An immediate consequence of such a direct transition in the Dirac cones is that EL is related to the wave vector of a photo-excited electron (and hole) k as EL = 2ħνFk, where νF is the electron’s velocity and k = |k|. Thus, increasing EL is equivalent to increasing the radius of the circle defined with respect to the K point shown in Fig. 2(b).
When a photo-excited electron emits an A1g phonon, the valley changes from K to K’ due to momentum conservation. Let the wave vector of the scattered electron be k', which is measured from the K’ point*1.Similarly, the photo-excited hole changes its valley from the K point to the K’ point when it emits an A1g phonon. In general, the hole is not scattered into the position just below the electron because the electron and hole are independently scattered by different A1g phonons. Only when the wave vectors of the scattered hole and electron are identical (as shown in Fig. 2(a)) can the hole and electron be annihilated by scattered light emission, which can be observed as the 2D band in the Raman spectrum.
3. Dominance of backward scatteringIf there is no preferred direction of k' for a given k, the q (≡k' – k) value cannot be specified. This is easy to recognize by projecting the process shown in Fig. 2(a) onto the two dimensional k-space shown in Fig. 2(b), in which the magnitude q = |q| is small for the forward scattering (q ≈ 0), denoted by the dashed arrow in Fig. 2(b), while it can be large for the backward scattering (q ≈ –2k). Interestingly, there is a strong probability that the electron will undergo backward scattering when it emits an A1g phonon, as shown in Fig. 2(c). Namely, although the forward scattering may be allowed by momentum conservation, it never takes place because the corresponding electron-phonon matrix element is suppressed. In fact, the calculated matrix element squared is proportional to 1– cos(Θ' – Θ), where Θ (Θ') is the angle between k (k') and the kx-axis. The matrix element squared vanishes for the forward scattering (Θ' = Θ), while it takes the maximum for the backward scattering (Θ' = Θ + π). Thus, the phonons whose wave vector satisfies q = |q| ≈ 2k contribute significantly to the 2D band. As a result, increasing the EL is equivalent to increasing linearly the magnitude of the wave vector of the phonon, q(EL) ≈ EL/ħνF.*2
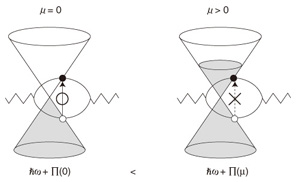
4. Phonon dispersion and self-energyThe next problem is the q dependence of ħω(q). Normally, the dispersion relation of phonons is calculated by using a classical model in which carbon atoms are connected by springs with some force constants. If we assume that the force constants are nonzero only for nearest-neighbor carbon atoms, it can be shown that the q dependence is negligible: ħω(q) = constant, for which we fail to explain the dispersive behavior of the 2D band. Thus, many studies have been done concerning the parameters including the force constants beyond the nearest-neighbor that can reproduce the experimental results. However, even if a classical model gives ħω(q) = constant, quantum mechanics can modify the q dependence of ħω(q) through the self-energy. The concept of self-energy is also essential in explaining the experimental result in which the energy of the G band increases as the Fermi energy μ increases (by doping). Suppose that a phonon with wave vector q hits an electron with wave vector k through electron-phonon interaction. The electron is transferred from the valence to the conduction bands, and the wave vector becomes k + q due to momentum conservation. Since q = 0 for the G band, the electron undergoes a vertical transition (Fig. 3). There are different vertical transitions depending on the value of k. These vertical electron-hole pairs are the intermediate (virtual) states of the phonon, so they return to the original phonon after a while. The important point here is that the presence/absence of the virtual states gives an observable consequence. Namely, the presence/absence of virtual states decreases/increases the phonon energy. As can be seen in Fig. 3, when μ is close to the Dirac point (i.e., μ ≈ 0), all possible virtual states exist. As a result, the phonon energy takes its minimum value because the correction to the energy, which is a negative quantity as Π(μ) ∝ – ∫μ∞dk/(2ħνF), is maximal in this case. By contrast, when the graphene is doped, some of the virtual states are forbidden by the exclusion principle, and the energy of the phonon increases. In fact, it can be shown that the self-energy Π(μ) is proportional to the density of states at μ, so Π(μ) increases linearly with |μ|.
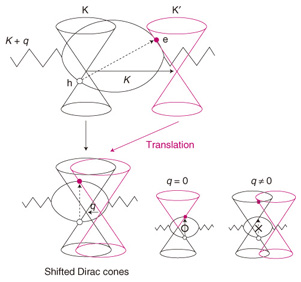
The dispersive behavior of the 2D band can be understood in terms of self-energy in a similar manner to the doping dependence of the G band. Suppose that the A1g phonon with wave vector K + q hits an electron near the K point with k, the electron is transferred from the valence to the conduction band, and the wave vector becomes k + (K + q), due to momentum conservation. To understand the self-energy of the phonon, we need to discuss an electron-hole pair that crosses two Dirac cones. However, the fact that the electron is very far from the hole makes it very difficult to consider the presence or absence of a virtual state. Therefore, let us displace this Dirac cone from the K’ point toward the K point by - K – q. Then the wave vector of the electron becomes k so that the electron is located just above the position where the hole is created. The vertical electron-hole pairs in shifted Dirac cones will be the virtual states of the A1g phonon. Let us assume that for clarity the Fermi energy is fixed at the Dirac point in Fig. 4. For the A1g phonon with q ≈ 0, we can expect from the discussion of the G band that the energy will reach its minimum due to the self-energy. For the A1g phonon with q ≠ 0, some of the low-energy virtual states are excluded, so the energy increases from q ≈ 0. This is very similar to the situation in which doping prevents the low-energy virtual states from contributing to the self-energy of the G band. The number of excluded virtual states increases almost linearly with the increasing q. In fact, a direct calculation shows that the self-energy is proportional to q, as Gep × π2ħνFq, where Gep is the electron-phonon coupling.
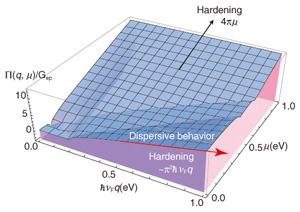
Since q is proportional to EL, the phonon energy exhibits a linear dependence on EL as ħω (EL) ∝ π2Gep EL, which is consistent with the measured dispersive behavior of the 2D band. The self-energy also depends on μ. More detailed information on the self-energy is shown in Fig. 5. Note that when μ ≈ 0, the self-energy follows Gep × π2ħνFq.
5. Summary and discussionWe have explored the origin of the dispersive behavior for the 2D band, which is the most prominent peak in the Raman spectrum of graphene, by employing two fundamental concepts. One is the self-energy of phonons. The other is the dominance of backward scattering for the A1g phonon, which is a property of electron-phonon interaction. Some comments on the latter concept are in order. Strictly speaking, the electron-phonon matrix element squared being proportional to 1 – cos (Θ' – Θ) does not necessarily mean that only the phonons that satisfy q = 2k contribute to the 2D band, because the probability is nonzero not only for the exact backward scattering (Θ' = Θ + π) but also for the approximate backward scattering (Θ' ≈ Θ + π). If we take the distribution of the approximate backward scatterings into account, it can be shown that the average q value is a little smaller than 2k. In fact, the average q value is given by introducing a numerical factor (1.3) as q ≈ EL/1.3ħνF. This prediction can be verified by examining the μ dependence of the width of the 2D band [2]. A reduction factor seems to be necessary to explain the recent experimental data [3]. Meanwhile, a calculation of the S-matrix, which takes off-resonance processes into account, for the 2D band suggests that the contribution of the phonon with q = 2k is strongly enhanced [4]. Thus, determining the exact q value is an unresolved problem. The concept of migration of Dirac cones used in understanding the virtual states for the self-energy of an A1g phonon may be important when graphene is subjected to strain. A uniform strain causes a shift of the Dirac cones, and the phonon’s q value would be changed by applying strain to a graphene sample. References
|
||||||||||||||