|
|||||||||||||||||||||||||||||||||||||||
|
|
|||||||||||||||||||||||||||||||||||||||
       |
Feature Articles: NTT’s Artificial Intelligence Evolves to Create Novel Services Vol. 16, No. 8, pp. 29–36, Aug. 2018. https://doi.org/10.53829/ntr201808fa5 Biosignal Processing Methods Targeting Healthcare Support ServicesAbstractNTT is pursuing research and development (R&D) of Heart-Touching-AI—artificial intelligence that will help better our understanding of human physical and mental states that are only dimly perceived by the individual. We provide here an overview of recent NTT R&D in biosignal processing for estimating physical and mental states using shirt-type wearable electrocardiogram (ECG) devices such as a “hitoe” shirt. We also explain how we dealt with the inherent problems in shirt-type wearable ECG devices. Keywords: wearable, “hitoe,” biosignal processing
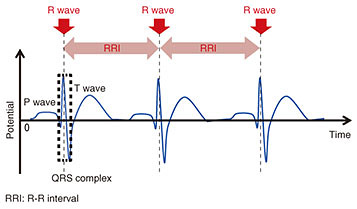
1. Wearable devices supporting everyday lifeWearable devices now make it easy to continuously measure biosignals of subjects and monitor their condition in daily life. To properly support people’s daily activities, it is important to inform them of their physical and mental states, which they may not be aware of, based on data measured from wearable devices. When people perform tasks that do not involve much physical exertion such as office work or driving, it is difficult to accurately gauge the actual workload from only the amount of physical activity. It is therefore important to encourage people to take breaks or other kinds of relaxation to improve their work efficiency or health management based on the actual workload. Attention also needs to be paid to the mental state of workers, which can also be affected by their workload. 2. Estimation of physical and mental states by heart rate variability analysisHeart rate variability (HRV) analysis is a well-known method to assess a person’s physical and mental states that involves analyzing the variations between heartbeats. It can shed light on the static balance between sympathetic nerves and parasympathetic nerves that form the autonomic nervous system [1, 2]. In the electrocardiogram (ECG) waveform shown in Fig. 1, the QRS complex corresponds to the depolarization of the ventricles of the heart; the time interval between two adjacent R waves is called the R-R interval (RRI). RRI time series data are known to have fluctuations called HRV, which could possibly reflect autonomic nervous system activity under specific conditions [1].
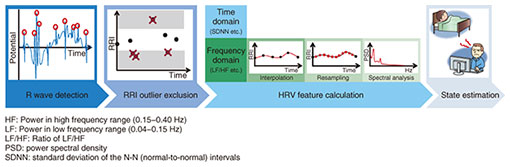
We focused on these physiological characteristics in developing some estimation algorithms targeting sleep stage [3, 4] or mental fatigue [5, 6]. These algorithms estimate the target state through the HRV analysis process shown in Fig. 2. We can use shirt-type wearable ECG devices such as a “hitoe” shirt*1 to measure the target ECGs before carrying out this process.
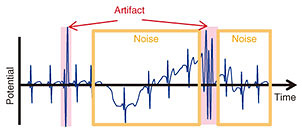
NTT Group companies are involved in developing and implementing practical products and services in collaboration with outside corporate partners. The “hitoe” shirt, developed in collaboration with Toray Industries, Inc., is used in one such practical application of a driver health management service [6]. This service is based on the fatigue state*2 estimation model that focuses on the relationship between various HRV features obtained through HRV analysis and the wearer’s fatigue state. A transmitter attached to a “hitoe” shirt worn by a driver measures ECG, calculates RRIs, and then sends those RRI time series data to the cloud in order to estimate the driver’s fatigue state by using a cloud-implemented fatigue state estimation model with parameters calibrated in advance. The model is thus able to continually monitor the fatigue level of the driver simply by having the driver wear the “hitoe” shirt. Note that the state estimation algorithms using HRV analysis described above generally need to apply an estimation model based on the relationship between HRV features and the target state. This means that those estimation algorithms basically require long-term continuous RRI time series data even when using shirt-type wearable ECG devices such as a “hitoe” shirt. However, ECG measurement electrodes embedded with shirt-type wearable ECG devices stretch along with the shirt itself when the user moves about, and this may cause measurement faults*3 as illustrated in Fig. 3. This is most often observed when the user twists around. Since measurement faults make it impossible to obtain accurate RRIs, conventional methods have excluded these data from HRV analysis to avoid obtaining inaccurate HRV features. In real life, however, people contort their bodies throughout the day; we toss and turn in bed, twist our torso as we turn the steering wheel, and stretch our body during breaks.
To allow for these situations without discarding a significant amount of measured data when conducting HRV analysis in daily life, a new data analysis scheme is required that incorporates advanced outlier processing. We explain in the following sections two new methods that enable more accurate HRV analysis with the goal of enhancing self-state awareness of users through the use of shirt-type wearable ECG devices like the “hitoe” shirt: ECG waveform analysis based on non-orthogonal wavelet expansion [8] and RRI outlier processing [9–11].
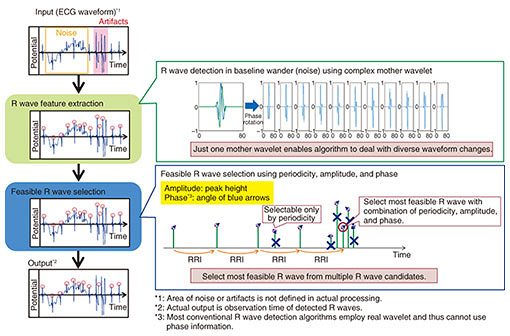
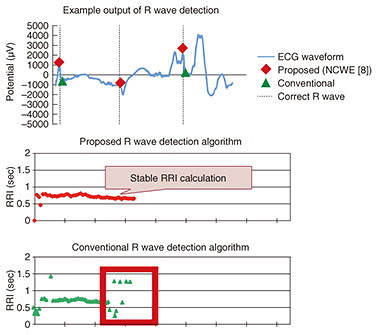
3. ECG waveform analysis based on non-orthogonal wavelet expansionThe primary goal of our ECG waveform analysis based on non-orthogonal wavelet expansion (hereafter, NCWE) [8] is to improve the accuracy of R wave detection in HRV analysis, which is the very first step shown in Fig. 2, even when analyzing ECG measured by shirt-type wearable ECG devices. Thus far, ECGs have generally been measured in the presence of physicians or medical technicians, who are responsible for discarding certain portions of ECGs containing measurement faults, so that even simple R wave detection algorithms can detect R waves. However, there are in general no medical personnel present to discard faulty results when ECGs are measured using shirt-type wearable ECG devices. Consequently, measurement faults inevitably make their way into the target ECGs. Moreover, measurement electrodes embedded with shirt-type wearable ECG devices may be attached at different points in accordance with the physique or body movements of users, and this may induce measurement faults or apparently different ECG waveforms. Many of the conventional simple R wave detection algorithms are often unable to follow these differences in ECG waveforms or to detect R waves buried in measurement faults accurately, and this may result in R wave misdetection or non-detection. This leads to RRI miscalculations, which make it virtually impossible to accurately calculate HRV features. Thus, when HRV features are calculated under everyday environments using a shirt-type wearable ECG device, it is critically important to employ a reliable R wave detection algorithm that is capable of handling measurement faults caused by body movements in order to minimize the instances of miscalculated RRIs (i.e., R wave misdetection and non-detection). NTT brought together experts from different NTT laboratories to develop a more accurate method of ECG waveform analysis. The members involved were from NTT Service Evolution Laboratories, where they have biosignal processing know-how, and from NTT Media Intelligence Laboratories, where they have audio/acoustic signal processing expertise. The ECG waveform analysis method they developed is based on NCWE and can detect more accurate R waves even when using shirt-type wearable ECG devices such as a “hitoe” shirt. A schematic overview of how our algorithm detects R waves from target ECGs is shown in Fig. 4. The algorithm puts a general wavelet transform used in audio/acoustic signal processing or ECG waveform analysis into practice to reduce the effects of measurement faults derived from body movements such as low-frequency noise and to detect R waves by following apparently diverse waveform changes of R waves. Furthermore, we reduce the number of misdetected R waves caused by measurement faults such as artifacts not by simply using all detected R waves as they are, but by using only feasible R wave candidates in RRI calculation; we select certain R wave candidates as feasible ones based on formerly measured R waves.
One key in this analysis scheme is a mother wavelet; we employed a complex wavelet as a mother wavelet for primary R wave detection, which makes it possible to detect R waves from ECGs with noise or artifacts measured by shirt-type wearable ECG devices. Most conventional R wave detection algorithms employ a real wavelet as a mother wavelet. This makes it hard to follow diverse changes of R waves by using just one mother wavelet. Our use of a complex wavelet instead of a real wavelet enables the algorithm to follow apparent R wave waveform changes by employing just one mother wavelet with phase rotation. Moreover, this phase information is utilized to select feasible R wave candidates. We select such candidates by making use of three different perspectives—periodicity, amplitude, and phase—all of which we calculate through ECG waveform analysis using NCWE. To verify the effectiveness of our ECG waveform analysis using NCWE under actual environmental conditions, we compared RRIs calculated using our approach with those resulting from a conventional R wave detection algorithm. We targeted the same ECGs measured with shirt-type wearable ECG devices while the user carried out normal exercises and body movements including stretching, bending, and twisting, all of which typically induce measurement faults. The experimental results shown in Fig. 5 indicate that our algorithm successfully calculated stable RRIs, in contrast to the conventional algorithm, even in the presence of measurement faults. This result indicates that our algorithm can potentially improve the accuracy of a range of processes including state estimation based on HRV using shirt-type wearable ECG devices such as a “hitoe” shirt by improving the accuracy of RRIs as well as HRV features calculated from RRIs.
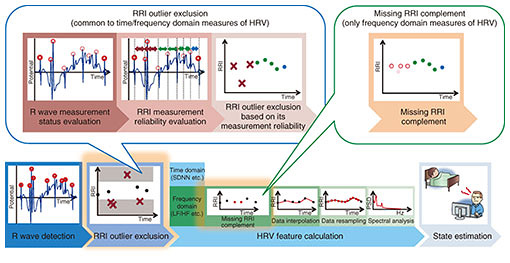
4. RRI outlier processingTo calculate more accurate RRIs and HRV features, our RRI outlier processing technique [9–11] focuses on misdetected R waves contained in the RRIs. This process should be conducted between R wave detection and HRV feature calculation in the HRV analysis (Fig. 2). A schematic diagram of our RRI outlier processing is illustrated in Fig. 6. Although there are many R wave detection algorithms as described above, it is almost impossible to completely suppress misdetected R waves due to artifacts, whose frequency characteristics are quite similar to those of R waves. Because HRV analysis only requires accurate RRIs without any outliers, we should exclude the misdetected RRIs derived in artifacts as outliers. However, conventional HRV analyses mostly target ECGs without any measurement faults and only exclude the RRIs as outliers whose duration characteristics deviate from those of the majority of RRIs. Therefore, we cannot exclude certain RRIs including misdetected R waves as outliers, especially when the duration characteristics of those RRIs are close to those of the other RRIs.
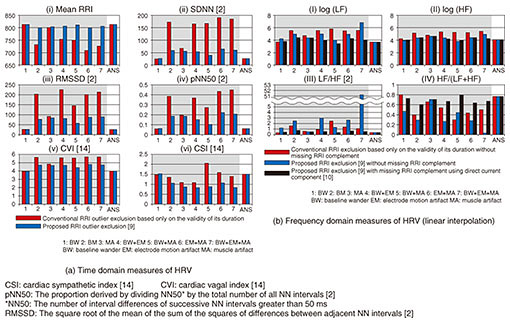
Another problem can occur when we calculate frequency domain measures of HRV (hereafter, fHRV) where we should conduct two additional preprocessing steps before feature calculation to appropriately analyze frequency characteristics of RRI time series data. These steps are data resampling using an interpolation function and power spectral density calculation by spectral analysis [1]. When the gap in missing RRIs is too long, we may fail to accurately calculate fHRV due to oscillation of the interpolation function to the outliers or due to overestimation of specific frequency components in data resampling using the interpolation function. To accurately calculate HRV features under these situations, our RRI outlier processing method conducts two additional processes based on inherent HRV analysis: RRI outlier exclusion [9] and missing RRI complementation [10, 11]. In RRI outlier exclusion, we exclude all RRIs that possibly include misdetected R waves based on the calculated measurement reliability. We first evaluate the measurement status of all detected R waves based on their electric potential and then evaluate the measurement reliability of RRIs based on the combined measurement status of two R waves. Thus, we can exclude certain RRIs with low measurement reliability as possible outliers derived from measurement faults [9]. Furthermore, when calculating fHRV, we complement missing RRIs before conducting data resampling in order to properly resample target data by using an interpolation function [10, 11]. The combination of RRI outlier exclusion and missing RRI complementation can limit the aforementioned problems that may occur in conventional data resampling and enable more accurate fHRV calculation. As a preliminary evaluation before the validation analysis under actual environmental conditions, we evaluated the effectiveness of RRI outlier exclusion and missing RRI complementation by using pseudo ECGs*4 with correct R wave annotation, which assumes inherent measurement faults occurring with shirt-type wearable ECG devices. The experimental results shown in Fig. 7 indicate that our proposed RRI outlier processing methods were effective for time domain measures of HRV (Fig. 7(a)) as well as fHRV (Fig. 7(b)), and combining both of them was more effective than RRI outlier exclusion alone in fHRV calculation. Furthermore, even more accurate HRV features could be calculated by combining an R wave detection algorithm based on NCWE and RRI outlier processing methods.
5. SummaryIn this article, we presented two new methods, ECG waveform analysis based on NCWE and RRI outlier processing, that work together as preprocessing steps in HRV analysis. The combination of both methods enables more accurate calculation of HRV features when using shirt-type wearable ECG devices such as a “hitoe” shirt and may indirectly contribute to expanding the use of such garments for sports or labor health management purposes. We will continue to pursue research and development activities to achieve healthcare support services using shirt-type wearable ECG devices including “hitoe” shirts in collaboration with other NTT Group companies. References
|
||||||||||||||||||||||||||||||||||||||