|
|||||||||||||||||
|
|
|||||||||||||||||
       |
Feature Articles: The Internet of Things and New Value Creation Vol. 15, No. 9, pp. 26–32, Sept. 2017. https://doi.org/10.53829/ntr201709fa5 Optimal Crowd Navigation via Spatio-temporal Multidimensional Collective Data AnalysisAbstractWe introduce technology for predicting the risk of congestion in the near future from real-time observational data of people or automobile flows and for automatically deriving an optimal crowd navigation plan online to avoid that risk. This technology can deal with unforeseen situations by performing simulations based on machine learning. Our aim in establishing this technology is to help construct a safe and secure and more comfortable social infrastructure. Keywords: spatio-temporal data analysis, congestion risk prediction, collective navigation
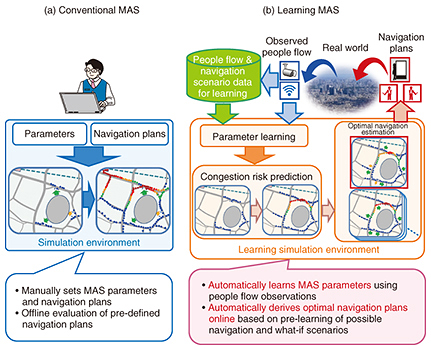
1. IntroductionThanks to improvements in sensing technology and the rapid spread of smartphone applications and devices making up the Internet of Things (IoT), it is becoming possible to measure diverse types of data such as the movement of vehicles and things, human behavior, and environmental changes from just about anywhere. However, it is extremely difficult to extract and appropriately apply significant and useful information lying latent in combinations of such diverse and massive amounts of data collected and stored in the above way. NTT is researching and developing Ambient-AI as an artificial intelligence (AI) technology targeting IoT [1]. The idea behind this technology is to obtain information on everything under the sun (things, people, the environment) from diverse types of data collected and stored in real space and cyber space, perform instantaneous event detection, analysis, and prediction based on that information, and feed the results back to the real world. A key technology supporting Ambient-AI is spatio-temporal multidimensional collective data analysis, which has come to be constructed in order to model the spatio-temporal relationships among multidimensional data having multiple attributes and to predict the place and time of a future event [2, 3]. This technology considers time, space, multidimensionality, and collectivity as four elements of data to foresee and gain insight on near-future events. Here, the idea behind collectivity is to estimate the spatio-temporal flow of people or vehicles only from aggregate data, as in the number of people or vehicles per cell, in which individual persons or cars cannot be identified. In this article, we introduce our latest research and development (R&D) efforts in extending this technology. Starting with real-space information on people or vehicles collected from real-time observations, we input this information online into a simulation environment in cyber space, model the spatio-temporal features of that information, instantaneously predict immediate congestion risk, and preemptively and optimally navigate the crowd to avoid that risk [4]. 2. Learning multi-agent simulationMulti-agent simulation (MAS) is becoming increasingly popular as a technique for modeling the individual behavior of autonomously acting entities (= agents) such as people, cars, animals, and insects, modeling the micro-interaction of those agents with the surrounding environment, and analyzing and predicting macro-phenomena uncovered from the interaction among multiple agents and their interaction with the environment. In fields commonly referred to as complex systems, it may be possible to understand and describe individual micro-behavior, say of the people making up a society, neurons making up the neural network of a brain, and molecules, atoms, and other elements in the atmosphere giving rise to various types of weather phenomena. However, analysis techniques using MAS have come to be widely researched for analyzing large-scale systems in which the overall macro-behavior of things such as social activities, brain activities, and weather phenomena cannot be broken down into the behavior of individual elements. These techniques have recently found use in sensor networks, smart grids, and intelligent transport systems and in evacuation guidance simulations for disaster preparedness. To give a specific example, we consider the navigation of tens of thousands of spectators exiting a stadium. In this case, individual spectators are agents who leave the stadium from their current locations via exits and move toward train stations as their destinations. In spectator movement, a commonly used model considers an average walking speed (e.g., 4 km/h) related to the attributes of individual spectators such as age and gender and the attenuation of that walking speed on traversed roads in a manner proportional to congestion conditions (crowd density). Crowd control manuals [5] state that passing becomes difficult and walking speed begins to drop at a crowd density of 1.2 persons/m2 and that movement comes to a halt at 4 persons/m2. Crowd density is also called service level [6], and the road width, space, and flow rate in pedestrian lanes that maintain a certain service level satisfying safety standards can be computed. In conventional analysis methods using MAS, it is common to manually set parameters such as walking speed and navigation plans such as pedestrian paths and flow rate and to conduct simulations to evaluate beforehand the effects of those plans. Such methods have been applied when actually implementing crowd control (Fig. 1(a)). However, these parameters and navigation plans are limited to a small number of combinations decided beforehand and do not necessarily match actual human movements or observed results based on navigation operations. Today, however, rapid progress in IoT and sensing technologies means that local people flow and congestion conditions in the real world can be measured in real time using a variety of positioning means such as surveillance cameras, GPS (global positioning system), Wi-Fi*, and beacons. With this in mind, the NTT laboratories are moving forward on the development of a learning MAS system that transfers events in real space such as people flow observed in real time to a simulation environment in cyber space, automatically learns modeled parameters based on observations, and predicts the spatio-temporal unfolding of events (Fig. 1(b)). The aim here is to establish technology based on the learning MAS to predict immediate congestion risk, automatically derive an optimal navigation plan online at any time to avoid that risk, and support navigation through crowd handlers and other personnel.
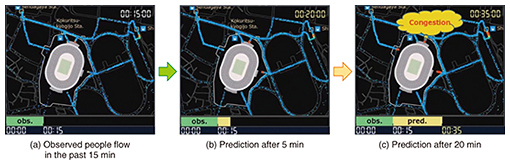
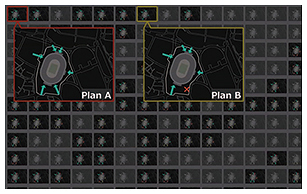
3. Prediction of immediate congestion risk and automatic derivation of an optimal navigation planAn example of an immediate prediction of congestion risk is shown in Fig. 2. First, people-flow data are obtained from real-time observations and input into a simulation environment. The prediction process takes some of that data, say from the immediately preceding 15 minutes, to simulate subsequent spatio-temporal behavior. That is, in combination with the spatio-temporal multidimensional collective data analysis described above, it predicts with high accuracy spatio-temporal congestion risk into the immediate future, that is, 5 minutes, 10 minutes, and 20 minutes later. In an example of the flow of spectators moving toward a stadium from nearby train stations, the process predicts that congestion will occur 20 minutes later, particularly near the entrance on the north side of the stadium (Fig. 2). The next step is to automatically generate potential navigation plans by computer to eliminate this congestion risk and to search for an optimal navigation plan (Fig. 3).
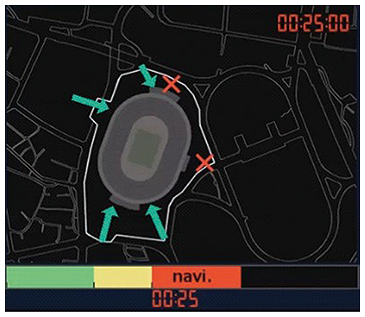
In this example, one navigation plan is to temporarily close one of the six stadium entrances and direct spectators toward the other entrances (Plan B in the figure). However, a huge number of combinations is possible when considering which entrances to close and when and for how long to close each one, or whether to completely or partially close a particular entrance. This process therefore efficiently prunes the massive number of candidate navigation plans and discards those that would have no effect on navigation, those that cannot actually be put into operation at the site, and those that may generate confusion, and then immediately searches for an optimal navigation plan. Various criteria can be considered here for optimality such as the shortest time required for all spectators to get inside the stadium or the minimum time or area in which spectators are held up due to congestion. However, it is difficult to directly evaluate which navigation plan has an optimal criterion value, and it is unrealistic to perform an exhaustive search of this massive search space. To solve this problem, we use a machine learning technique called Bayesian optimization that efficiently searches for promising candidates from a small number of search results to derive an optimal navigation plan. For example, with the search results of Fig. 3, this technique derives a navigation plan that closes two of the stadium entrances at the 25-minute point (Fig. 4). This plan can be presented to crowd handlers to help them navigate arriving spectators. Here, we can expect spectator behavior to generally change due to such navigation, but not all spectators will necessarily comply with that navigation. Accordingly, this technique takes into account continuous observations and predictions of new congestion risks to repeatedly search for an optimal navigation plan and perform actual crowd control in the same way as above through a feedback loop.
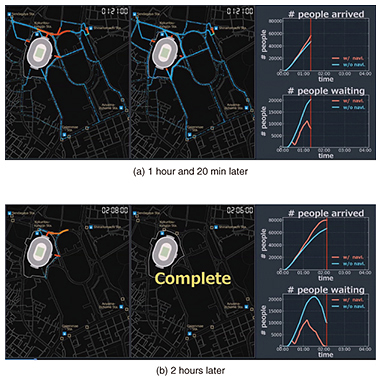
4. Examples of application to entering/exiting stadiumThe results of simulations for a scene with 80,000 spectators entering a stadium with and without optimal navigation are shown in Fig. 5 for comparison purposes. The people flow at the point 1 hour and 20 minutes after spectators begin to arrive at the station and make their way toward the stadium is shown in Fig. 5(a). For the case without navigation shown at the left of the figure, the concentration of nearby train stations on the north side of the stadium results in congestion at the entrances near those stations and the appearance on public roads of queues of spectators that are held up and cannot move forward.
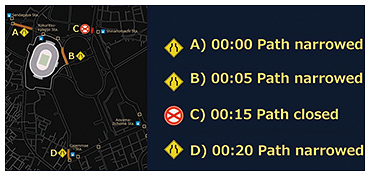
In contrast, for the case with navigation shown in the center of the figure, crowding at particular entrances is avoided by blocking access to north-side entrances at key locations, thereby minimizing the generation of queues on public paths. With the navigation plan, all spectators were able to arrive and be inside the stadium at about the two-hour point, as shown in the center of Fig. 5(b). However, without navigation (left side of Fig. 5(b)), time is needed to naturally clear congestion, and it would be about another hour until all spectators were inside the stadium. A graph with the vertical axis representing the number of people waiting and the horizontal axis representing time is shown at the lower right of Fig. 5(a) and 5(b). It can be seen that with navigation, the number of people waiting is kept low. Therefore, determining how to minimize the number of people waiting is an important issue, particularly for events held during the hot summer months. The proposed technique is expected to be effective in this regard. Next, we consider a scene of 80,000 spectators exiting a stadium and making their way toward nearby stations. We examine, in particular, a scenario in which unforeseen situations (e.g., accidents) not envisioned in prior studies in conventional navigation planning occur in rapid succession at four locations within 20 minutes after spectators begin to exit (Fig. 6). It is assumed here that the flow of people walking toward the stations and the flow of people coming out of the stations become intertwined, that the widths of some roads are reduced (path narrowed) due, for example, to the arrival of emergency vehicles (locations A, B, and D in the figure), and that a road is closed (path closed) due to an accident (location C).
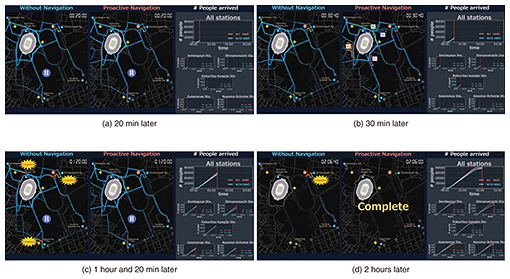
The results of simulations performed to determine whether the proposed technique can derive an optimal navigation plan even under such unforeseen conditions is shown in Fig. 7. First, simulation results are shown in Fig. 7(a) for the point 20 minutes after people begin exiting the stadium, when accidents at four locations occur. At this time, the flow of people is the same with or without navigation, but a red congestion location starts to appear due to the effects of the path closure in the upper right portion of the map.
Next, simulation results at 30 minutes are shown in Fig. 7(b). With navigation, the proposed technique clears congestion by directing people to a detour to avoid the congestion caused by the above path closure. It can be seen from the results for the point 2 hours later in Fig. 7(d) that all spectators have arrived at their target stations. With no navigation, however, congestion occurs at various locations 1 hour and 20 minutes later, as shown in Fig. 7(c). Even at 2 hours later as shown in Fig. 7(d), congestion has yet to be cleared, and compared with the results with navigation, many people have to wait for 30 minutes or longer. In this way, the proposed technology is not limited to the occurrence of accidents envisioned beforehand; it can also predict immediate congestion for the multiple and ongoing occurrence of unforeseen situations and automatically derive an optimal navigation plan at any time. 5. Future outlookPeople-flow simulation introduced in this article has been based for the most part on pseudo data generated from statistics on past numbers of train station users and other information. NTT, however, is developing a learning-oriented simulation environment based on actual measurements of people flow at actual event venues and stadiums. We expect the application of this technology to extend beyond people flow to include risk prediction and optimal infrastructure control for flows in various types of social infrastructures such as traffic flow, logistics, and even communications traffic. As we look forward to 2020, we will continue to measure flow in peripheral areas including large-scale event venues, train stations, and road networks and will work on making simulations increasingly detailed. Our aim through these R&D efforts is to achieve optimal crowd navigation technology that can deal with unforeseen situations. References
|
||||||||||||||||